Examples
Featured Tutorials
PyThresh has a variety of different thresholding methods and an online example can be found at.
Towards Data Science: Thresholding Outlier Detection Scores with PyThresh
Karcher Mean Example
Full example: karch_example.py
Import models
from pyod.models.knn import KNN
from pyod.utils.data import generate_data

from pyod.utils.data import evaluate_print
from pyod.utils.example import visualize

from pythresh.thresholds.karch import KARCH
Generate sample data with
pyod.utils.data.generate_data():contamination = 0.1 # percentage of outliers n_train = 200 # number of training points n_test = 100 # number of testing points X_train, X_test, y_train, y_test = generate_data( n_train=n_train, n_test=n_test, n_features=2, contamination=contamination, random_state=42, )
3. Initialize a pyod.models.knn.KNN detector, fit the model,
and threshold the outlier detection scores.
# train kNN detector
clf_name = "KNN"
clf = KNN()
clf.fit(X_train)
thres = KARCH()

# get the prediction labels and outlier scores of the training data
y_train_scores = clf.decision_scores_  # raw outlier scores

# (Legacy method)
#y_train_pred = thres.eval(y_train_scores)

thres.fit(y_train_scores)
y_train_pred = thres.labels_  # binary labels (0: inliers, 1: outliers)

# get the prediction on the test data
y_test_scores = clf.decision_function(X_test)  # outlier scores

# (Legacy method)
#y_test_pred = thres.eval(y_test_scores)
y_test_pred = thres.predict(y_test_scores)
Evaluate the prediction using ROC and Precision @ Rank n
pyod.utils.data.evaluate_print().from pyod.utils.data import evaluate_print # evaluate and print the results print("\nOn Training Data:") evaluate_print(clf_name, y_train, y_train_scores) print("\nOn Test Data:") evaluate_print(clf_name, y_test, y_test_scores)
See sample outputs on both training and test data.
On Training Data:
KNN ROC:0.9992, precision @ rank n:0.95

On Test Data:
KNN ROC:1.0, precision @ rank n:1.0
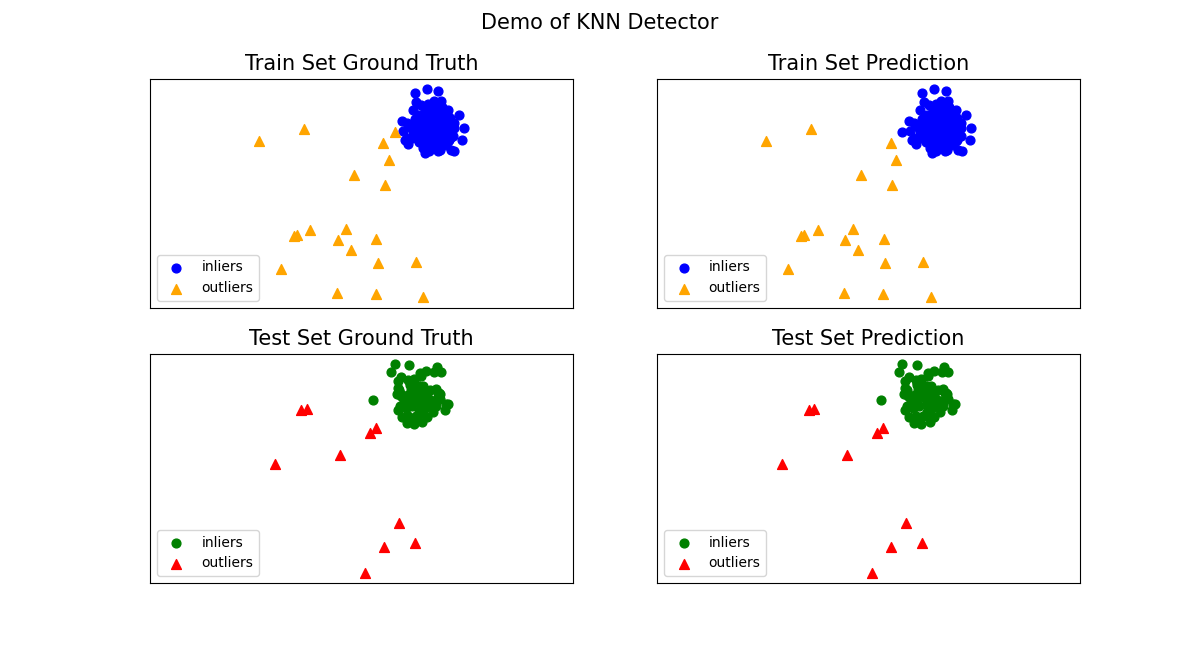
Generate the visualizations by visualize function included in all examples.
visualize(
    clf_name,
    X_train,
    y_train,
    X_test,
    y_test,
    y_train_pred,
    y_test_pred,
    show_figure=True,
    save_figure=False,
)
Model Combination Example
Just as outlier detection often suffers from model instability, a thresholding method may as well due to its unsupervised nature. Thus, it is recommended to combine various thresholders outputs, e.g., by averaging, to improve its robustness. Luckily this has already been written for convenience as the function pythresh.thresholds.comb.COMB
Additional API Example
1. Get the normalized threshold value that separates the inliers from outliers after the likelihood scores have been evaluated. Note, the outlier detection likelihood scores are normalized between 0 and 1.
# train kNN detector
clf_name = "KNN"
clf = KNN()
clf.fit(X_train)

scores = clf.decision_function(X_train)
thres = OCSVM()
thres.fit(scores)

labels = thres.labels_

threshold = thres.thresh_
This can also be done for multiple outlier detector likelihood scores sets. These scores are first decomposed to 1D using a TruncatedSVD decomposition method. This decomposed score sets can also be accessed as a stores variable dscores_
# train multiple detectors
clf_name = "Multiple"
clfs = [KNN(), IForest(), PCA()]

scores = []
for clf in clfs:
   clf.fit(X_train)
   scores.append(clf.decision_function(X_train))

scores = np.vstack(scores).T

thres = OCSVM()
thres.fit(scores)

labels = thres.labels_

threshold = thres.thresh_
dscores = thres.dscores_
3. Similarly, the lower and upper confidence interval of the
contamination level for the pythresh.thresholds.comb.COMB
thresholder can be retrieved.
# train kNN detector
clf_name = "KNN"
clf = KNN()
clf.fit(X_train)

scores = clf.decision_function(X_train)
thres = COMB()
thres.fit(scores)

labels = thres.labels_

conf_interval = thres.confidence_interval_
Tutorial Notebooks
Notebook |
Description |
|---|---|
Basic intro into outlier thresholding |
|
Additional thresholding options for more advanced use |
|
Calculating the confidence levels around the threshold point |
|
Assisting in selecting the best performing outlier and thresholding method combo using ranking |
References