All Models
pythresh.thresholds.aucp module
- class pythresh.thresholds.aucp.AUCP(fallback='warn', random_state=1234)[source]
Bases:
BaseThresholderAUCP class for Area Under Curve Precentage thresholder.
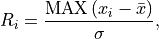
Use the area under the curve to evaluate a non-parametric means to threshold scores generated by the decision_scores where outliers are set to any value beyond where the auc of the kde is less than the (mean + abs(mean-median)) percent of the total kde auc. See [RYZ+18] for details
- Parameters:
fallback (str ('ignore', 'warn', 'raise'), optional (default='warn')) – The action to take for thresholders when their criterion are not met. In these cases when set to ‘ignore’ on eval and fit all train data is set to inliers and the threshold is set to max of the train scores + eps. Passing ‘warn’ will do the same as ‘ignore’ but also produce a warning. If ‘raise’, the thresholder raises a ValueError.
random_state (int, optional (default=1234)) – Random seed for the random number generators of the thresholders. Can also be set to None.
- thresh_
- Type:
threshold value that separates inliers from outliers
- dscores_
- Type:
1D array of decomposed decision scores
Notes
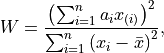
The area under the curve (AUC) is defined as follows:
where
 is the curve and
  is the incremental step size
of the rectangles whose areas will be summed up. The AUCP method generates a
curve using the pdf of the normalized decision scores over a range of 0-1.
This is done with a kernel density estimation. The incremental size step is
is the incremental step size
of the rectangles whose areas will be summed up. The AUCP method generates a
curve using the pdf of the normalized decision scores over a range of 0-1.
This is done with a kernel density estimation. The incremental size step is
 , with
  being the number of points of the decision scores.
The AUC is continuously calculated in steps from the left to right of the data range starting from 0. The stopping limit is set to
 , where
  is the mean decision score, and
  is the median decision score.
The first AUC that is greater than the total AUC of the pdf multiplied by the
 is set as the threshold between inliers and outliers.
- eval(decision)[source]
Outlier/inlier evaluation process for decision scores.
- Parameters:
decision (np.array or list of shape (n_samples)) – or np.array of shape (n_samples, n_detectors) which are the decision scores from a outlier detection.
- Returns:
outlier_labels – For each observation, tells whether or not it should be considered as an outlier according to the fitted model. 0 stands for inliers and 1 for outliers.
- Return type:
numpy array of shape (n_samples,)
- fit(X, y=None)
Outlier/inlier fit process for decision scores.
- Parameters:
decision (np.array or list of shape (n_samples)) – or np.array of shape (n_samples, n_detectors) which are the decision scores from a outlier detection.
- get_metadata_routing()
Get metadata routing of this object.
Please check User Guide on how the routing mechanism works.
- Returns:
routing – A
MetadataRequestencapsulating routing information.- Return type:
MetadataRequest
- get_params(deep=True)
Get parameters for this estimator.
- predict(X)
Outlier/inlier predict process for decision scores.
- Parameters:
decision (np.array or list of shape (n_samples)) – or np.array of shape (n_samples, n_detectors) which are the decision scores from a outlier detection.
- Returns:
outlier_labels – For each observation, tells whether or not it should be considered as an outlier according to the fitted model. 0 stands for inliers and 1 for outliers.
- Return type:
numpy array of shape (n_samples,)
- set_params(**params)
Set the parameters of this estimator.
The method works on simple estimators as well as on nested objects (such as
Pipeline). The latter have parameters of the form<component>__<parameter>so that it’s possible to update each component of a nested object.- Parameters:
**params (dict) – Estimator parameters.
- Returns:
self – Estimator instance.
- Return type:
estimator instance
pythresh.thresholds.boot module
- class pythresh.thresholds.boot.BOOT(random_state=1234)[source]
Bases:
BaseThresholderBOOT class for Bootstrapping thresholder.
Use a bootstrapping based method to find a non-parametric means to threshold scores generated by the decision_scores where outliers are set to any value beyond the mean of the confidence intervals. See [MR06] for details
- Parameters:
random_state (int, optional (default=1234)) – Random seed for bootstrapping a confidence interval. Can also be set to None.
- thresh_
- Type:
threshold value that separates inliers from outliers
- dscores_
- Type:
1D array of decomposed decision scores
Notes
The two sided bias-corrected and accelerated bootstrap confidence interval is calculated with a confidence level of 0.95. The statistic calculating the confidence interval is the standard deviation of the decision scores, with the statistic treating corresponding elements of the samples in the decision scores as paired
The returned upper and lower confidence intervals are used to threshold the decision scores. Outliers are set to any value above the mean of the upper and lower confidence intervals.
Examples
The effects of randomness can affect the thresholder’s output performance significantly. Therefore, to alleviate the effects of randomness on the thresholder a combined model can be used with different random_state values. E.g.
# train the KNN detector
from pyod.models.knn import KNN
from pythresh.thresholds.comb import COMB
from pythresh.thresholds.boot import BOOT

clf = KNN()
clf.fit(X_train)

# get outlier scores
decision_scores = clf.decision_scores_  # raw outlier scores

# get outlier labels with combined model
thres = COMB(thresholders = [BOOT(random_state=1234),
BOOT(random_state=42), BOOT(random_state=9685),
BOOT(random_state=111222)])
labels = thres.eval(decision_scores)
- eval(decision)[source]
Outlier/inlier evaluation process for decision scores.
- Parameters:
decision (np.array or list of shape (n_samples)) – or np.array of shape (n_samples, n_detectors) which are the decision scores from a outlier detection.
- Returns:
outlier_labels – For each observation, tells whether or not it should be considered as an outlier according to the fitted model. 0 stands for inliers and 1 for outliers.
- Return type:
numpy array of shape (n_samples,)
- fit(X, y=None)
Outlier/inlier fit process for decision scores.
- Parameters:
decision (np.array or list of shape (n_samples)) – or np.array of shape (n_samples, n_detectors) which are the decision scores from a outlier detection.
- get_metadata_routing()
Get metadata routing of this object.
Please check User Guide on how the routing mechanism works.
- Returns:
routing – A
MetadataRequestencapsulating routing information.- Return type:
MetadataRequest
- get_params(deep=True)
Get parameters for this estimator.
- predict(X)
Outlier/inlier predict process for decision scores.
- Parameters:
decision (np.array or list of shape (n_samples)) – or np.array of shape (n_samples, n_detectors) which are the decision scores from a outlier detection.
- Returns:
outlier_labels – For each observation, tells whether or not it should be considered as an outlier according to the fitted model. 0 stands for inliers and 1 for outliers.
- Return type:
numpy array of shape (n_samples,)
- set_params(**params)
Set the parameters of this estimator.
The method works on simple estimators as well as on nested objects (such as
Pipeline). The latter have parameters of the form<component>__<parameter>so that it’s possible to update each component of a nested object.- Parameters:
**params (dict) – Estimator parameters.
- Returns:
self – Estimator instance.
- Return type:
estimator instance
pythresh.thresholds.chau module
- class pythresh.thresholds.chau.CHAU(method='effective', random_state=1234)[source]
Bases:
BaseThresholderCHAU class for Chauvenet’s criterion thresholder.
Use the Chauvenet’s criterion to evaluate a non-parametric means to threshold scores generated by the decision_scores where outliers are set to any value below the Chauvenet’s criterion. See [BU75] for details
- Parameters:
method ({'classic', 'effective'}, optional (default='effective')) –
Determines how the threshold is computed:
’classic’: Uses the classical Chauvenet’s criterion based on all samples.
’effective’: Uses an entropy-based effective sample size to adjust the threshold.
random_state (int, optional (default=1234)) – Random seed for the random number generators of the thresholders. Can also be set to None.
- thresh_
- Type:
threshold value that separates inliers from outliers
- dscores_
- Type:
1D array of decomposed decision scores
Notes
The classical Chauvenet’s criterion identifies outliers in a dataset by computing a threshold based on the z-score of each observation:

where
is the mean and  the standard deviation
of the dataset. An observation is considered an outlier if the probability
of obtaining a value at least as extreme is less than
the standard deviation
of the dataset. An observation is considered an outlier if the probability
of obtaining a value at least as extreme is less than
with
 being the total number of samples. The corresponding z-score
threshold is then given by the inverse survival function of the standard
normal distribution:
being the total number of samples. The corresponding z-score
threshold is then given by the inverse survival function of the standard
normal distribution:
Any observation with
 is flagged as an outlier.
In the ‘effective’ method, the classical threshold is adjusted by an entropy-based effective sample size. This accounts for situations where the dataset may contain correlated or redundant samples, reducing the effective number of independent observations. The effective sample size
 is estimated as
where
 is the entropy of the histogram of standardized scores.
The threshold probability is then
is the entropy of the histogram of standardized scores.
The threshold probability is then
which typically results in a more conservative threshold that adapts to the actual variability and redundancy in the data.
- eval(decision)[source]
Outlier/inlier evaluation process for decision scores.
- Parameters:
decision (np.array or list of shape (n_samples)) – or np.array of shape (n_samples, n_detectors) which are the decision scores from a outlier detection.
- Returns:
outlier_labels – For each observation, tells whether or not it should be considered as an outlier according to the fitted model. 0 stands for inliers and 1 for outliers.
- Return type:
numpy array of shape (n_samples,)
- fit(X, y=None)
Outlier/inlier fit process for decision scores.
- Parameters:
decision (np.array or list of shape (n_samples)) – or np.array of shape (n_samples, n_detectors) which are the decision scores from a outlier detection.
- get_metadata_routing()
Get metadata routing of this object.
Please check User Guide on how the routing mechanism works.
- Returns:
routing – A
MetadataRequestencapsulating routing information.- Return type:
MetadataRequest
- get_params(deep=True)
Get parameters for this estimator.
- predict(X)
Outlier/inlier predict process for decision scores.
- Parameters:
decision (np.array or list of shape (n_samples)) – or np.array of shape (n_samples, n_detectors) which are the decision scores from a outlier detection.
- Returns:
outlier_labels – For each observation, tells whether or not it should be considered as an outlier according to the fitted model. 0 stands for inliers and 1 for outliers.
- Return type:
numpy array of shape (n_samples,)
- set_params(**params)
Set the parameters of this estimator.
The method works on simple estimators as well as on nested objects (such as
Pipeline). The latter have parameters of the form<component>__<parameter>so that it’s possible to update each component of a nested object.- Parameters:
**params (dict) – Estimator parameters.
- Returns:
self – Estimator instance.
- Return type:
estimator instance
pythresh.thresholds.clf module
- class pythresh.thresholds.clf.CLF(method='complex', random_state=1234)[source]
Bases:
BaseThresholderCLF class for Trained Classifier thresholder.
Use the trained linear classifier to evaluate a non-parametric means to threshold scores generated by the decision_scores where outliers are set to any value beyond 0. See [Agg17] for details.
- Parameters:
method ({'simple', 'complex'}, optional (default='complex')) –
Type of linear model
’simple’: Uses only the scores
’complex’: Uses the scores, log of the scores, and the scores’ PDF
random_state (int, optional (default=1234)) – Random seed for the random number generators of the thresholders. Can also be set to None.
- thresh_
- Type:
threshold value that separates inliers from outliers
- dscores_
- Type:
1D array of decomposed decision scores
Notes
The classifier was trained using a linear stochastic gradient decent method. A warm start was assigned to the classifier was partially fit with the decision scores and true labels from multiple outlier detection methods available in PyOD. The
generate_datafunction from PyOD was used to create the outlier data, and the contaminations and random states were randomized each iterative step.- eval(decision)[source]
Outlier/inlier evaluation process for decision scores.
- Parameters:
decision (np.array or list of shape (n_samples)) – or np.array of shape (n_samples, n_detectors) which are the decision scores from a outlier detection.
- Returns:
outlier_labels – For each observation, tells whether or not it should be considered as an outlier according to the fitted model. 0 stands for inliers and 1 for outliers.
- Return type:
numpy array of shape (n_samples,)
- fit(X, y=None)
Outlier/inlier fit process for decision scores.
- Parameters:
decision (np.array or list of shape (n_samples)) – or np.array of shape (n_samples, n_detectors) which are the decision scores from a outlier detection.
- get_metadata_routing()
Get metadata routing of this object.
Please check User Guide on how the routing mechanism works.
- Returns:
routing – A
MetadataRequestencapsulating routing information.- Return type:
MetadataRequest
- get_params(deep=True)
Get parameters for this estimator.
- predict(X)
Outlier/inlier predict process for decision scores.
- Parameters:
decision (np.array or list of shape (n_samples)) – or np.array of shape (n_samples, n_detectors) which are the decision scores from a outlier detection.
- Returns:
outlier_labels – For each observation, tells whether or not it should be considered as an outlier according to the fitted model. 0 stands for inliers and 1 for outliers.
- Return type:
numpy array of shape (n_samples,)
- set_params(**params)
Set the parameters of this estimator.
The method works on simple estimators as well as on nested objects (such as
Pipeline). The latter have parameters of the form<component>__<parameter>so that it’s possible to update each component of a nested object.- Parameters:
**params (dict) – Estimator parameters.
- Returns:
self – Estimator instance.
- Return type:
estimator instance
pythresh.thresholds.clust module
pythresh.thresholds.comb module
- class pythresh.thresholds.comb.COMB(thresholders='default', max_contam=0.5, method='stacked', fallback='warn', random_state=1234)[source]
Bases:
BaseThresholderCOMB class for Combined thresholder.
Use multiple thresholders as a non-parametric means to threshold scores generated by the decision_scores where outliers are set to any value beyond the (mean, median, or mode) of the contamination from the selected combination of thresholders.
- Parameters:
thresholders (list, optional (default='default')) – List of instantiated thresholders, e.g. [DSN(), FILTER()]. Default is [DSN(random_state=self.random_state), FILTER(), OCSVM(random_state=self.random_state)]
max_contam (float, optional (default=0.5)) – Maximum contamination allowed for each threshold output. Thresholded scores above the maximum contamination will not be included in the final combined threshold
method ({'mean', 'median', 'mode', 'bagged', 'stacked}, optional (default='stacked')) –
evaluation method to apply to contamination levels
’mean’: calculate the mean combined threshold
’median’: calculate the median combined threshold
’mode’: calculate the majority vote or mode of the thresholded labels
’bagged’: use a bagged LaplaceGaussianNB to solve the combined threshold
’stacked’: use a stacked Ridge, and LaplaceGaussianNB classifier combined method
fallback (str ('ignore', 'warn', 'raise'), optional (default='warn')) – The action to take for thresholders when their criterion are not met. In these cases when set to ‘ignore’ on eval and fit all train data is set to inliers and the threshold is set to max of the train scores + eps. Passing ‘warn’ will do the same as ‘ignore’ but also produce a warning. If ‘raise’, the thresholder raises a ValueError.
random_state (int, optional (default=1234)) – Random seed for the random number generators of the thresholders. Can also be set to None.
- thresh_
- Type:
threshold value that separates inliers from outliers
- confidence_interval_
- Type:
lower and upper confidence interval of the contamination level
- dscores_
- Type:
1D array of decomposed decision scores
- eval(decision)[source]
Outlier/inlier evaluation process for decision scores.
- Parameters:
decision (np.array or list of shape (n_samples)) – or np.array of shape (n_samples, n_detectors) which are the decision scores from a outlier detection.
- Returns:
outlier_labels – For each observation, tells whether or not it should be considered as an outlier according to the fitted model. 0 stands for inliers and 1 for outliers.
- Return type:
numpy array of shape (n_samples,)
- get_metadata_routing()
Get metadata routing of this object.
Please check User Guide on how the routing mechanism works.
- Returns:
routing – A
MetadataRequestencapsulating routing information.- Return type:
MetadataRequest
- get_params(deep=True)
Get parameters for this estimator.
- set_params(**params)
Set the parameters of this estimator.
The method works on simple estimators as well as on nested objects (such as
Pipeline). The latter have parameters of the form<component>__<parameter>so that it’s possible to update each component of a nested object.- Parameters:
**params (dict) – Estimator parameters.
- Returns:
self – Estimator instance.
- Return type:
estimator instance
pythresh.thresholds.cpd module
- class pythresh.thresholds.cpd.CPD(method='Dynp', transform='cdf', random_state=1234)[source]
Bases:
BaseThresholderCPD class for Change Point Detection thresholder.
Use change point detection to find a non-parametric means to threshold scores generated by the decision_scores where outliers are set to any value beyond the detected change point. See [FR16] for details
- Parameters:
method ({'Dynp', 'KernelCPD', 'Binseg', 'BottomUp'}, optional (default='Dynp')) –
Method for change point detection
’Dynp’: Dynamic programming (optimal minimum sum of errors per partition)
’KernelCPD’: RBF kernel function (optimal minimum sum of errors per partition)
’Binseg’: Binary segmentation
’BottomUp’: Bottom-up segmentation
transform ({'cdf', 'kde'}, optional (default='cdf')) –
Data transformation method prior to fit
’cdf’: Use the cumulative distribution function
’kde’: Use the kernel density estimation
random_state (int, optional (default=1234)) – Random seed for the random number generators of the thresholders. Can also be set to None.
- thresh_
- Type:
threshold value that separates inliers from outliers
- dscores_
- Type:
1D array of decomposed decision scores
- eval(decision)[source]
Outlier/inlier evaluation process for decision scores.
- Parameters:
decision (np.array or list of shape (n_samples)) – or np.array of shape (n_samples, n_detectors) which are the decision scores from a outlier detection.
- Returns:
outlier_labels – For each observation, tells whether or not it should be considered as an outlier according to the fitted model. 0 stands for inliers and 1 for outliers.
- Return type:
numpy array of shape (n_samples,)
- fit(X, y=None)
Outlier/inlier fit process for decision scores.
- Parameters:
decision (np.array or list of shape (n_samples)) – or np.array of shape (n_samples, n_detectors) which are the decision scores from a outlier detection.
- get_metadata_routing()
Get metadata routing of this object.
Please check User Guide on how the routing mechanism works.
- Returns:
routing – A
MetadataRequestencapsulating routing information.- Return type:
MetadataRequest
- get_params(deep=True)
Get parameters for this estimator.
- predict(X)
Outlier/inlier predict process for decision scores.
- Parameters:
decision (np.array or list of shape (n_samples)) – or np.array of shape (n_samples, n_detectors) which are the decision scores from a outlier detection.
- Returns:
outlier_labels – For each observation, tells whether or not it should be considered as an outlier according to the fitted model. 0 stands for inliers and 1 for outliers.
- Return type:
numpy array of shape (n_samples,)
- set_params(**params)
Set the parameters of this estimator.
The method works on simple estimators as well as on nested objects (such as
Pipeline). The latter have parameters of the form<component>__<parameter>so that it’s possible to update each component of a nested object.- Parameters:
**params (dict) – Estimator parameters.
- Returns:
self – Estimator instance.
- Return type:
estimator instance
pythresh.thresholds.decomp module
- class pythresh.thresholds.decomp.DECOMP(method='PCA', random_state=1234)[source]
Bases:
BaseThresholderDECOMP class for Decomposition based thresholders.
Use decomposition to evaluate a non-parametric means to threshold scores generated by the decision_scores where outliers are set to any value beyond the maximum of the decomposed matrix that results from decomposing the cumulative distribution function of the decision scores. See [BP02] for details
- Parameters:
method ({'NMF', 'PCA', 'GRP', 'SRP'}, optional (default='PCA')) –
Method to use for decomposition
’NMF’: Non-Negative Matrix Factorization
’PCA’: Principal Component Analysis
’GRP’: Gaussian Random Projection
’SRP’: Sparse Random Projection
random_state (int, optional (default=1234)) – Random seed for the decomposition algorithm. Can also be set to None.
- thresh_
- Type:
threshold value that separates inliers from outliers
- dscores_
- Type:
1D array of decomposed decision scores
Examples
The effects of randomness can affect the thresholder’s output performance significantly. Therefore, to alleviate the effects of randomness on the thresholder a combined model can be used with different random_state values. E.g.
# train the KNN detector
from pyod.models.knn import KNN
from pythresh.thresholds.comb import COMB
from pythresh.thresholds.decomp import DECOMP

clf = KNN()
clf.fit(X_train)

# get outlier scores
decision_scores = clf.decision_scores_  # raw outlier scores

# get outlier labels with combined model
thres = COMB(thresholders = [DECOMP(random_state=1234),
DECOMP(random_state=42), DECOMP(random_state=9685),
DECOMP(random_state=111222)])
labels = thres.eval(decision_scores)
- eval(decision)[source]
Outlier/inlier evaluation process for decision scores.
- Parameters:
decision (np.array or list of shape (n_samples)) – or np.array of shape (n_samples, n_detectors) which are the decision scores from a outlier detection.
- Returns:
outlier_labels – For each observation, tells whether or not it should be considered as an outlier according to the fitted model. 0 stands for inliers and 1 for outliers.
- Return type:
numpy array of shape (n_samples,)
- fit(X, y=None)
Outlier/inlier fit process for decision scores.
- Parameters:
decision (np.array or list of shape (n_samples)) – or np.array of shape (n_samples, n_detectors) which are the decision scores from a outlier detection.
- get_metadata_routing()
Get metadata routing of this object.
Please check User Guide on how the routing mechanism works.
- Returns:
routing – A
MetadataRequestencapsulating routing information.- Return type:
MetadataRequest
- get_params(deep=True)
Get parameters for this estimator.
- predict(X)
Outlier/inlier predict process for decision scores.
- Parameters:
decision (np.array or list of shape (n_samples)) – or np.array of shape (n_samples, n_detectors) which are the decision scores from a outlier detection.
- Returns:
outlier_labels – For each observation, tells whether or not it should be considered as an outlier according to the fitted model. 0 stands for inliers and 1 for outliers.
- Return type:
numpy array of shape (n_samples,)
- set_params(**params)
Set the parameters of this estimator.
The method works on simple estimators as well as on nested objects (such as
Pipeline). The latter have parameters of the form<component>__<parameter>so that it’s possible to update each component of a nested object.- Parameters:
**params (dict) – Estimator parameters.
- Returns:
self – Estimator instance.
- Return type:
estimator instance
pythresh.thresholds.dsn module
- class pythresh.thresholds.dsn.DSN(metric='MAH', random_state=1234)[source]
Bases:
BaseThresholderDSN class for Distance Shift from Normal thresholder.
Use the distance shift from normal to evaluate a non-parametric means to threshold scores generated by the decision_scores where outliers are set to any value beyond the distance calculated by the selected metric. See [AOH21] for details.
- Parameters:
metric ({'JS', 'WS', 'ENG', 'BHT', 'HLL', 'HI', 'LK', 'LP', 'MAH', 'TMT', 'RES', 'KS', 'INT', 'MMD'}, optional (default='MAH')) –
Metric to use for distance computation
’JS’: Jensen-Shannon distance
’WS’: Wasserstein or Earth Movers distance
’ENG’: Energy distance
’BHT’: Bhattacharyya distance
’HLL’: Hellinger distance
’HI’: Histogram intersection distance
’LK’: Lukaszyk-Karmowski metric for normal distributions
’LP’: Levy-Prokhorov metric
’MAH’: Mahalanobis distance
’TMT’: Tanimoto distance
’RES’: Studentized residual distance
’KS’: Kolmogorov-Smirnov distance
’INT’: Weighted spline interpolated distance
’MMD’: Maximum Mean Discrepancy distance
random_state (int, optional (default=1234)) – Random seed for the normal distribution. Can also be set to None.
- thresh_
- Type:
threshold value that separates inliers from outliers
- dscores_
- Type:
1D array of decomposed decision scores
Examples
The effects of randomness can affect the thresholder’s output performance significantly. Therefore, to alleviate the effects of randomness on the thresholder a combined model can be used with different random_state values. E.g.
# train the KNN detector
from pyod.models.knn import KNN
from pythresh.thresholds.comb import COMB
from pythresh.thresholds.dsn import DSN

clf = KNN()
clf.fit(X_train)

# get outlier scores
decision_scores = clf.decision_scores_  # raw outlier scores

# get outlier labels with combined model
thres = COMB(thresholders = [DSN(random_state=1234),
DSN(random_state=42), DSN(random_state=9685),
DSN(random_state=111222)])
labels = thres.eval(decision_scores)
- eval(decision)[source]
Outlier/inlier evaluation process for decision scores.
- Parameters:
decision (np.array or list of shape (n_samples)) – or np.array of shape (n_samples, n_detectors) which are the decision scores from a outlier detection.
- Returns:
outlier_labels – For each observation, tells whether or not it should be considered as an outlier according to the fitted model. 0 stands for inliers and 1 for outliers.
- Return type:
numpy array of shape (n_samples,)
- fit(X, y=None)
Outlier/inlier fit process for decision scores.
- Parameters:
decision (np.array or list of shape (n_samples)) – or np.array of shape (n_samples, n_detectors) which are the decision scores from a outlier detection.
- get_metadata_routing()
Get metadata routing of this object.
Please check User Guide on how the routing mechanism works.
- Returns:
routing – A
MetadataRequestencapsulating routing information.- Return type:
MetadataRequest
- get_params(deep=True)
Get parameters for this estimator.
- predict(X)
Outlier/inlier predict process for decision scores.
- Parameters:
decision (np.array or list of shape (n_samples)) – or np.array of shape (n_samples, n_detectors) which are the decision scores from a outlier detection.
- Returns:
outlier_labels – For each observation, tells whether or not it should be considered as an outlier according to the fitted model. 0 stands for inliers and 1 for outliers.
- Return type:
numpy array of shape (n_samples,)
- set_params(**params)
Set the parameters of this estimator.
The method works on simple estimators as well as on nested objects (such as
Pipeline). The latter have parameters of the form<component>__<parameter>so that it’s possible to update each component of a nested object.- Parameters:
**params (dict) – Estimator parameters.
- Returns:
self – Estimator instance.
- Return type:
estimator instance
pythresh.thresholds.dummy module
- class pythresh.thresholds.dummy.DUMMY(contam=None, fallback='warn', random_state=1234)[source]
Bases:
BaseThresholderDUMMY class for dummy thresholder.
Use the DUMMY thresholder to threshold based on a given contamination level. This is useful for benchmarking.
- Parameters:
contam (float in (0., 1.0) or None, optional (default=None)) – The amount of contamination of the data set, i.e. the proportion of outliers in the data set. Used when fitting to define the threshold on the decision function. Default None sets no outliers to exist in the training data.
fallback (str ('ignore', 'warn', 'raise'), optional (default='warn')) – The action to take for thresholders when their criterion are not met. In these cases when set to ‘ignore’ on eval and fit all train data is set to inliers and the threshold is set to max of the train scores + eps. Passing ‘warn’ will do the same as ‘ignore’ but also produce a warning. If ‘raise’, the thresholder raises a ValueError.
random_state (int, optional (default=1234)) – Random seed for the random number generators of the thresholders. Can also be set to None.
- thresh_
- Type:
threshold value that separates inliers from outliers
- dscores_
- Type:
1D array of decomposed decision scores
- eval(decision)[source]
Outlier/inlier evaluation process for decision scores.
- Parameters:
decision (np.array or list of shape (n_samples)) – or np.array of shape (n_samples, n_detectors) which are the decision scores from a outlier detection.
- Returns:
outlier_labels – For each observation, tells whether or not it should be considered as an outlier according to the fitted model. 0 stands for inliers and 1 for outliers.
- Return type:
numpy array of shape (n_samples,)
- fit(X, y=None)
Outlier/inlier fit process for decision scores.
- Parameters:
decision (np.array or list of shape (n_samples)) – or np.array of shape (n_samples, n_detectors) which are the decision scores from a outlier detection.
- get_metadata_routing()
Get metadata routing of this object.
Please check User Guide on how the routing mechanism works.
- Returns:
routing – A
MetadataRequestencapsulating routing information.- Return type:
MetadataRequest
- get_params(deep=True)
Get parameters for this estimator.
- predict(X)
Outlier/inlier predict process for decision scores.
- Parameters:
decision (np.array or list of shape (n_samples)) – or np.array of shape (n_samples, n_detectors) which are the decision scores from a outlier detection.
- Returns:
outlier_labels – For each observation, tells whether or not it should be considered as an outlier according to the fitted model. 0 stands for inliers and 1 for outliers.
- Return type:
numpy array of shape (n_samples,)
- set_params(**params)
Set the parameters of this estimator.
The method works on simple estimators as well as on nested objects (such as
Pipeline). The latter have parameters of the form<component>__<parameter>so that it’s possible to update each component of a nested object.- Parameters:
**params (dict) – Estimator parameters.
- Returns:
self – Estimator instance.
- Return type:
estimator instance
pythresh.thresholds.eb module
- class pythresh.thresholds.eb.EB(random_state=1234)[source]
Bases:
BaseThresholderEB class for Elliptical Boundary thresholder.
Use pseudo-random elliptical boundaries to evaluate a non-parametric means to threshold scores generated by the decision_scores where outliers are set to any value beyond a pseudo-random elliptical boundary set between inliers and outliers. See [FMF13] for details.
- Parameters:
random_state (int, optional (default=1234)) – Random seed for the random number generators of the thresholders. Can also be set to None.
- thresh_
- Type:
threshold value that separates inliers from outliers
- dscores_
- Type:
1D array of decomposed decision scores
Notes
Pseudo-random eccentricities are used to generate elliptical boundaries and threshold the decision scores. This is done by using the farthest point on the perimeter of an ellipse from its center and is defined as:
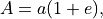
where
 is the eccentricity and
  is the semi-major axis.
If the decision scores are normalized the farthest point on the perimeter
of an ellipse from its center is equal to 1, and the semi-major
axis can be solved. The threshold is then set as the closest point on the
perimeter of an ellipse from its center.
is the semi-major axis.
If the decision scores are normalized the farthest point on the perimeter
of an ellipse from its center is equal to 1, and the semi-major
axis can be solved. The threshold is then set as the closest point on the
perimeter of an ellipse from its center.This is repeated with Monte Carlo simulations and the median number of inliers is selected from these thresholds. The pseudo-random eccentricity that produces a threshold that is closest to median sampled inlier count is applied as the output threshold.
- eval(decision)[source]
Outlier/inlier evaluation process for decision scores.
- Parameters:
decision (np.array or list of shape (n_samples)) – or np.array of shape (n_samples, n_detectors) which are the decision scores from a outlier detection.
- Returns:
outlier_labels – For each observation, tells whether or not it should be considered as an outlier according to the fitted model. 0 stands for inliers and 1 for outliers.
- Return type:
numpy array of shape (n_samples,)
- fit(X, y=None)
Outlier/inlier fit process for decision scores.
- Parameters:
decision (np.array or list of shape (n_samples)) – or np.array of shape (n_samples, n_detectors) which are the decision scores from a outlier detection.
- get_metadata_routing()
Get metadata routing of this object.
Please check User Guide on how the routing mechanism works.
- Returns:
routing – A
MetadataRequestencapsulating routing information.- Return type:
MetadataRequest
- get_params(deep=True)
Get parameters for this estimator.
- predict(X)
Outlier/inlier predict process for decision scores.
- Parameters:
decision (np.array or list of shape (n_samples)) – or np.array of shape (n_samples, n_detectors) which are the decision scores from a outlier detection.
- Returns:
outlier_labels – For each observation, tells whether or not it should be considered as an outlier according to the fitted model. 0 stands for inliers and 1 for outliers.
- Return type:
numpy array of shape (n_samples,)
- set_params(**params)
Set the parameters of this estimator.
The method works on simple estimators as well as on nested objects (such as
Pipeline). The latter have parameters of the form<component>__<parameter>so that it’s possible to update each component of a nested object.- Parameters:
**params (dict) – Estimator parameters.
- Returns:
self – Estimator instance.
- Return type:
estimator instance
pythresh.thresholds.fgd module
- class pythresh.thresholds.fgd.FGD(fallback='warn', random_state=1234)[source]
Bases:
BaseThresholderFGD class for Fixed Gradient Descent thresholder.
Use the fixed gradient descent to evaluate a non-parametric means to threshold scores generated by the decision_scores where outliers are set to any value beyond where the first derivative of the kde with respect to the decision scores passes the mean of the first and second inflection points. See [QJC21] for details.
- Parameters:
fallback (str ('ignore', 'warn', 'raise'), optional (default='warn')) – The action to take for thresholders when their criterion are not met. In these cases when set to ‘ignore’ on eval and fit all train data is set to inliers and the threshold is set to max of the train scores + eps. Passing ‘warn’ will do the same as ‘ignore’ but also produce a warning. If ‘raise’, the thresholder raises a ValueError.
random_state (int, optional (default=1234)) – Random seed for the random number generators of the thresholders. Can also be set to None.
- thresh_
- Type:
threshold value that separates inliers from outliers
- dscores_
- Type:
1D array of decomposed decision scores
Notes
A probability distribution of the decision scores is generated using kernel density estimation. The first derivative of the pdf is calculated, and the threshold is set as the middle point between the first and second inflection points starting from the left side of the data range.
- eval(decision)[source]
Outlier/inlier evaluation process for decision scores.
- Parameters:
decision (np.array or list of shape (n_samples)) – or np.array of shape (n_samples, n_detectors) which are the decision scores from a outlier detection.
- Returns:
outlier_labels – For each observation, tells whether or not it should be considered as an outlier according to the fitted model. 0 stands for inliers and 1 for outliers.
- Return type:
numpy array of shape (n_samples,)
- fit(X, y=None)
Outlier/inlier fit process for decision scores.
- Parameters:
decision (np.array or list of shape (n_samples)) – or np.array of shape (n_samples, n_detectors) which are the decision scores from a outlier detection.
- get_metadata_routing()
Get metadata routing of this object.
Please check User Guide on how the routing mechanism works.
- Returns:
routing – A
MetadataRequestencapsulating routing information.- Return type:
MetadataRequest
- get_params(deep=True)
Get parameters for this estimator.
- predict(X)
Outlier/inlier predict process for decision scores.
- Parameters:
decision (np.array or list of shape (n_samples)) – or np.array of shape (n_samples, n_detectors) which are the decision scores from a outlier detection.
- Returns:
outlier_labels – For each observation, tells whether or not it should be considered as an outlier according to the fitted model. 0 stands for inliers and 1 for outliers.
- Return type:
numpy array of shape (n_samples,)
- set_params(**params)
Set the parameters of this estimator.
The method works on simple estimators as well as on nested objects (such as
Pipeline). The latter have parameters of the form<component>__<parameter>so that it’s possible to update each component of a nested object.- Parameters:
**params (dict) – Estimator parameters.
- Returns:
self – Estimator instance.
- Return type:
estimator instance
pythresh.thresholds.filter module
- class pythresh.thresholds.filter.FILTER(method='savgol', sigma='auto', random_state=1234)[source]
Bases:
BaseThresholderFILTER class for Filtering based thresholders.
Use the filtering based methods to evaluate a non-parametric means to threshold scores generated by the decision_scores where outliers are set to any value beyond the maximum filter value. See [HGRR19] for details.
- Parameters:
method ({'gaussian', 'savgol', 'hilbert', 'wiener', 'medfilt', 'decimate','detrend', 'resample'}, optional (default='savgol')) –
Method to filter the scores
’gaussian’: use a gaussian based filter
’savgol’: use the savgol based filter
’hilbert’: use the hilbert based filter
’wiener’: use the wiener based filter
’medfilt: use a median based filter
’decimate’: use a decimate based filter
’detrend’: use a detrend based filter
’resample’: use a resampling based filter
sigma (int, optional (default='auto')) –
Variable specific to each filter type, default sets sigma to len(scores)*np.std(scores)
’gaussian’: standard deviation for Gaussian kernel
’savgol’: savgol filter window size
’hilbert’: number of Fourier components
’medfilt: kernel size
’decimate’: downsampling factor
’detrend’: number of break points
’resample’: resampling window size
random_state (int, optional (default=1234)) – Random seed for the random number generators of the thresholders. Can also be set to None.
- thresh_
- Type:
threshold value that separates inliers from outliers
- dscores_
- Type:
1D array of decomposed decision scores
- eval(decision)[source]
Outlier/inlier evaluation process for decision scores.
- Parameters:
decision (np.array or list of shape (n_samples)) – or np.array of shape (n_samples, n_detectors) which are the decision scores from a outlier detection.
- Returns:
outlier_labels – For each observation, tells whether or not it should be considered as an outlier according to the fitted model. 0 stands for inliers and 1 for outliers.
- Return type:
numpy array of shape (n_samples,)
- fit(X, y=None)
Outlier/inlier fit process for decision scores.
- Parameters:
decision (np.array or list of shape (n_samples)) – or np.array of shape (n_samples, n_detectors) which are the decision scores from a outlier detection.
- get_metadata_routing()
Get metadata routing of this object.
Please check User Guide on how the routing mechanism works.
- Returns:
routing – A
MetadataRequestencapsulating routing information.- Return type:
MetadataRequest
- get_params(deep=True)
Get parameters for this estimator.
- predict(X)
Outlier/inlier predict process for decision scores.
- Parameters:
decision (np.array or list of shape (n_samples)) – or np.array of shape (n_samples, n_detectors) which are the decision scores from a outlier detection.
- Returns:
outlier_labels – For each observation, tells whether or not it should be considered as an outlier according to the fitted model. 0 stands for inliers and 1 for outliers.
- Return type:
numpy array of shape (n_samples,)
- set_params(**params)
Set the parameters of this estimator.
The method works on simple estimators as well as on nested objects (such as
Pipeline). The latter have parameters of the form<component>__<parameter>so that it’s possible to update each component of a nested object.- Parameters:
**params (dict) – Estimator parameters.
- Returns:
self – Estimator instance.
- Return type:
estimator instance
pythresh.thresholds.fwfm module
- class pythresh.thresholds.fwfm.FWFM(fallback='warn', random_state=1234)[source]
Bases:
BaseThresholderFWFM class for Full Width at Full Minimum thresholder.
Use the full width at full minimum (aka base width) to evaluate a non-parametric means to threshold scores generated by the decision_scores where outliers are set to any value beyond the base width. See [Jon13] for details.
- Parameters:
fallback (str ('ignore', 'warn', 'raise'), optional (default='warn')) – The action to take for thresholders when their criterion are not met. In these cases when set to ‘ignore’ on eval and fit all train data is set to inliers and the threshold is set to max of the train scores + eps. Passing ‘warn’ will do the same as ‘ignore’ but also produce a warning. If ‘raise’, the thresholder raises a ValueError.
random_state (int, optional (default=1234)) – Random seed for the random number generators of the thresholders. Can also be set to None.
- thresh_
- Type:
threshold value that separates inliers from outliers
- dscores_
- Type:
1D array of decomposed decision scores
Notes
The outlier detection scores are assumed to be a mixture of Gaussian distributions. The probability density function of this Gaussian mixture is approximated using kernel density estimation. The highest peak within the PDF is used to find the base width of the mixture and the threshold is set to the base width divided by the number of scores.
- eval(decision)[source]
Outlier/inlier evaluation process for decision scores.
- Parameters:
decision (np.array or list of shape (n_samples)) – or np.array of shape (n_samples, n_detectors) which are the decision scores from a outlier detection.
- Returns:
outlier_labels – For each observation, tells whether or not it should be considered as an outlier according to the fitted model. 0 stands for inliers and 1 for outliers.
- Return type:
numpy array of shape (n_samples,)
- fit(X, y=None)
Outlier/inlier fit process for decision scores.
- Parameters:
decision (np.array or list of shape (n_samples)) – or np.array of shape (n_samples, n_detectors) which are the decision scores from a outlier detection.
- get_metadata_routing()
Get metadata routing of this object.
Please check User Guide on how the routing mechanism works.
- Returns:
routing – A
MetadataRequestencapsulating routing information.- Return type:
MetadataRequest
- get_params(deep=True)
Get parameters for this estimator.
- predict(X)
Outlier/inlier predict process for decision scores.
- Parameters:
decision (np.array or list of shape (n_samples)) – or np.array of shape (n_samples, n_detectors) which are the decision scores from a outlier detection.
- Returns:
outlier_labels – For each observation, tells whether or not it should be considered as an outlier according to the fitted model. 0 stands for inliers and 1 for outliers.
- Return type:
numpy array of shape (n_samples,)
- set_params(**params)
Set the parameters of this estimator.
The method works on simple estimators as well as on nested objects (such as
Pipeline). The latter have parameters of the form<component>__<parameter>so that it’s possible to update each component of a nested object.- Parameters:
**params (dict) – Estimator parameters.
- Returns:
self – Estimator instance.
- Return type:
estimator instance
pythresh.thresholds.gamgmm module
- class pythresh.thresholds.gamgmm.GAMGMM(n_contaminations=1000, n_draws=50, p0=0.01, phigh=0.01, high_gamma=0.15, gamma_lim=0.5, K=100, skip=False, steps=100, random_state=1234, verbose=False)[source]
Bases:
BaseThresholderGAMGMM class for gammaGMM thresholder.
Use a Bayesian method for estimating the posterior distribution of the contamination factor (i.e., the proportion of anomalies) for a given unlabeled dataset. The threshold is set such that the proportion of predicted anomalies equals the contamination factor. See [PBurknerK23] for details.
- Parameters:
n_contaminations (int, optional (default=1000)) – number of samples to draw from the contamination posterior distribution
n_draws (int, optional (default=50)) – number of samples simultaneously drawn from each DPGMM component
p0 (float, optional (default=0.01)) – probability that no anomalies are in the data
phigh (float, optional (default=0.01)) – probability that there are more than high_gamma anomalies
high_gamma (float, optional (default=0.15)) – sensibly high number of anomalies that has low probability to occur
gamma_lim (float, optional (default=0.5)) – Upper gamma/proportion of anomalies limit
K (int, optional (default=100)) – number of components for DPGMM used to approximate the Dirichlet Process
skip (bool, optional (default=False)) – skip optimal hyperparameter test (this may return a sub-optimal solution)
steps (int, optional (default=100)) – number of iterations to test for optimal hyperparameters
random_state (int, optional (default=1234)) – Random seed for the random number generators of the thresholders. Can also be set to None.
verbose (bool, optional (default=False)) – 20 iterations step printout of the DPGMM process
- thresh_
- Type:
threshold value that separates inliers from outliers
- dscores_
- Type:
1D array of decomposed decision scores
Notes
This implementation deviates from that in [PBurknerK23] only in the post-processing page. These deviations include: if a single outlier detector likelihood score set is passed a dummy score set of zeros will be added such that GAMGMM method can function correctly, if multiple outlier detector likelihood score sets are passed a TruncatedSVD 1D decomposed will be thresholded but not used to determine the gamma contamination. However, if you wish to follow the original implementation please go to GammaGMM
- eval(decision)[source]
Outlier/inlier evaluation process for decision scores.
- Parameters:
decision (np.array or list of shape (n_samples)) – or np.array of shape (n_samples, n_detectors) which are the decision scores from a outlier detection.
- Returns:
outlier_labels – For each observation, tells whether or not it should be considered as an outlier according to the fitted model. 0 stands for inliers and 1 for outliers.
- Return type:
numpy array of shape (n_samples,n_contaminations)
- fit(X, y=None)
Outlier/inlier fit process for decision scores.
- Parameters:
decision (np.array or list of shape (n_samples)) – or np.array of shape (n_samples, n_detectors) which are the decision scores from a outlier detection.
- get_metadata_routing()
Get metadata routing of this object.
Please check User Guide on how the routing mechanism works.
- Returns:
routing – A
MetadataRequestencapsulating routing information.- Return type:
MetadataRequest
- get_params(deep=True)
Get parameters for this estimator.
- predict(X)
Outlier/inlier predict process for decision scores.
- Parameters:
decision (np.array or list of shape (n_samples)) – or np.array of shape (n_samples, n_detectors) which are the decision scores from a outlier detection.
- Returns:
outlier_labels – For each observation, tells whether or not it should be considered as an outlier according to the fitted model. 0 stands for inliers and 1 for outliers.
- Return type:
numpy array of shape (n_samples,)
- set_params(**params)
Set the parameters of this estimator.
The method works on simple estimators as well as on nested objects (such as
Pipeline). The latter have parameters of the form<component>__<parameter>so that it’s possible to update each component of a nested object.- Parameters:
**params (dict) – Estimator parameters.
- Returns:
self – Estimator instance.
- Return type:
estimator instance
pythresh.thresholds.gesd module
- class pythresh.thresholds.gesd.GESD(max_outliers='auto', alpha=0.05, fallback='warn', random_state=1234)[source]
Bases:
BaseThresholderGESD class for Generalized Extreme Studentized Deviate thresholder.
Use the generalized extreme studentized deviate to evaluate a non-parametric means to threshold scores generated by the decision_scores where outliers are set to any less than the smallest detected outlier. See [Alr21] for details.
- Parameters:
max_outliers (int, optional (default='auto')) – maximum number of outliers that the dataset may have. Default sets max_outliers to be half the size of the dataset
alpha (float, optional (default=0.05)) – significance level
fallback (str ('ignore', 'warn', 'raise'), optional (default='warn')) – The action to take for thresholders when their criterion are not met. In these cases when set to ‘ignore’ on eval and fit all train data is set to inliers and the threshold is set to max of the train scores + eps. Passing ‘warn’ will do the same as ‘ignore’ but also produce a warning. If ‘raise’, the thresholder raises a ValueError.
random_state (int, optional (default=1234)) – Random seed for the random number generators of the thresholders. Can also be set to None.
- thresh_
- Type:
threshold value that separates inliers from outliers
- dscores_
- Type:
1D array of decomposed decision scores
Notes
The generalized extreme studentized deviate is defined for the hypothesis:
H0: There are no outliers in the decision scores
Ha: There are up to r amount of outliers in the decision scores
The test statistic is given as,
where
and are the mean and standard
deviation of the decision scores respectively.The GESD maximized
 value is removed from the decision scores and
the r test statistic is recomputed and is tested against the r critical
values:
value is removed from the decision scores and
the r test statistic is recomputed and is tested against the r critical
values: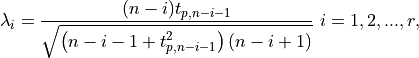
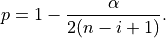
where
 is the
  for a t-distribution with
 degrees of freedom such that for a selected significance level
 :
:
The threshold for the decision scores is set to the smallest score that fulfills the condition
 .
.- eval(decision)[source]
Outlier/inlier evaluation process for decision scores.
- Parameters:
decision (np.array or list of shape (n_samples)) – or np.array of shape (n_samples, n_detectors) which are the decision scores from a outlier detection.
- Returns:
outlier_labels – For each observation, tells whether or not it should be considered as an outlier according to the fitted model. 0 stands for inliers and 1 for outliers.
- Return type:
numpy array of shape (n_samples,)
- fit(X, y=None)
Outlier/inlier fit process for decision scores.
- Parameters:
decision (np.array or list of shape (n_samples)) – or np.array of shape (n_samples, n_detectors) which are the decision scores from a outlier detection.
- get_metadata_routing()
Get metadata routing of this object.
Please check User Guide on how the routing mechanism works.
- Returns:
routing – A
MetadataRequestencapsulating routing information.- Return type:
MetadataRequest
- get_params(deep=True)
Get parameters for this estimator.
- predict(X)
Outlier/inlier predict process for decision scores.
- Parameters:
decision (np.array or list of shape (n_samples)) – or np.array of shape (n_samples, n_detectors) which are the decision scores from a outlier detection.
- Returns:
outlier_labels – For each observation, tells whether or not it should be considered as an outlier according to the fitted model. 0 stands for inliers and 1 for outliers.
- Return type:
numpy array of shape (n_samples,)
- set_params(**params)
Set the parameters of this estimator.
The method works on simple estimators as well as on nested objects (such as
Pipeline). The latter have parameters of the form<component>__<parameter>so that it’s possible to update each component of a nested object.- Parameters:
**params (dict) – Estimator parameters.
- Returns:
self – Estimator instance.
- Return type:
estimator instance
pythresh.thresholds.hist module
- class pythresh.thresholds.hist.HIST(method='triangle', nbins='auto', random_state=1234)[source]
Bases:
BaseThresholderHIST class for Histogram based thresholders.
Use histograms methods as described in scikit-image.filters to evaluate a non-parametric means to threshold scores generated by the decision_scores where outliers are set by histogram generated thresholds depending on the selected methods. See [TVAJS15] for details.
- Parameters:
nbins (int, optional (default='auto')) – Number of bins to use in the histogram, default set to int(len(scores)**0.7)
method ({'otsu', 'yen', 'isodata', 'li', 'minimum', 'triangle'}, optional (default='triangle')) –
Histogram filtering based method
’otsu’: OTSU’s method for filtering
’yen’: Yen’s method for filtering
’isodata’: Ridler-Calvard or inter-means method for filtering
’li’: Li’s iterative Minimum Cross Entropy method for filtering
’minimum’: Minimum between two maxima via smoothing method for filtering
’triangle’: Triangle algorithm method for filtering
random_state (int, optional (default=1234)) – Random seed for the random number generators of the thresholders. Can also be set to None.
- thresh_
- Type:
threshold value that separates inliers from outliers
- dscores_
- Type:
1D array of decomposed decision scores
- eval(decision)[source]
Outlier/inlier evaluation process for decision scores.
- Parameters:
decision (np.array or list of shape (n_samples)) – or np.array of shape (n_samples, n_detectors) which are the decision scores from a outlier detection.
- Returns:
outlier_labels – For each observation, tells whether or not it should be considered as an outlier according to the fitted model. 0 stands for inliers and 1 for outliers.
- Return type:
numpy array of shape (n_samples,)
- fit(X, y=None)
Outlier/inlier fit process for decision scores.
- Parameters:
decision (np.array or list of shape (n_samples)) – or np.array of shape (n_samples, n_detectors) which are the decision scores from a outlier detection.
- get_metadata_routing()
Get metadata routing of this object.
Please check User Guide on how the routing mechanism works.
- Returns:
routing – A
MetadataRequestencapsulating routing information.- Return type:
MetadataRequest
- get_params(deep=True)
Get parameters for this estimator.
- predict(X)
Outlier/inlier predict process for decision scores.
- Parameters:
decision (np.array or list of shape (n_samples)) – or np.array of shape (n_samples, n_detectors) which are the decision scores from a outlier detection.
- Returns:
outlier_labels – For each observation, tells whether or not it should be considered as an outlier according to the fitted model. 0 stands for inliers and 1 for outliers.
- Return type:
numpy array of shape (n_samples,)
- set_params(**params)
Set the parameters of this estimator.
The method works on simple estimators as well as on nested objects (such as
Pipeline). The latter have parameters of the form<component>__<parameter>so that it’s possible to update each component of a nested object.- Parameters:
**params (dict) – Estimator parameters.
- Returns:
self – Estimator instance.
- Return type:
estimator instance
pythresh.thresholds.iqr module
- class pythresh.thresholds.iqr.IQR(random_state=1234)[source]
Bases:
BaseThresholderIQR class for Inter-Qaurtile Region thresholder.
Use the inter-quartile region to evaluate a non-parametric means to threshold scores generated by the decision_scores where outliers are set to any value beyond the third quartile plus 1.5 times the inter-quartile region. See [BD15] for details.
- Parameters:
random_state (int, optional (default=1234)) – Random seed for the random number generators of the thresholders. Can also be set to None.
- thresh_
- Type:
threshold value that separates inliers from outliers
- dscores_
- Type:
1D array of decomposed decision scores
Notes
The inter-quartile region is given as:
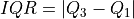
where
 and
and  are the first and third quartile
respectively. The threshold for the decision scores is set as:
are the first and third quartile
respectively. The threshold for the decision scores is set as: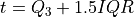
- eval(decision)[source]
Outlier/inlier evaluation process for decision scores.
- Parameters:
decision (np.array or list of shape (n_samples)) – or np.array of shape (n_samples, n_detectors) which are the decision scores from a outlier detection.
- Returns:
outlier_labels – For each observation, tells whether or not it should be considered as an outlier according to the fitted model. 0 stands for inliers and 1 for outliers.
- Return type:
numpy array of shape (n_samples,)
- fit(X, y=None)
Outlier/inlier fit process for decision scores.
- Parameters:
decision (np.array or list of shape (n_samples)) – or np.array of shape (n_samples, n_detectors) which are the decision scores from a outlier detection.
- get_metadata_routing()
Get metadata routing of this object.
Please check User Guide on how the routing mechanism works.
- Returns:
routing – A
MetadataRequestencapsulating routing information.- Return type:
MetadataRequest
- get_params(deep=True)
Get parameters for this estimator.
- predict(X)
Outlier/inlier predict process for decision scores.
- Parameters:
decision (np.array or list of shape (n_samples)) – or np.array of shape (n_samples, n_detectors) which are the decision scores from a outlier detection.
- Returns:
outlier_labels – For each observation, tells whether or not it should be considered as an outlier according to the fitted model. 0 stands for inliers and 1 for outliers.
- Return type:
numpy array of shape (n_samples,)
- set_params(**params)
Set the parameters of this estimator.
The method works on simple estimators as well as on nested objects (such as
Pipeline). The latter have parameters of the form<component>__<parameter>so that it’s possible to update each component of a nested object.- Parameters:
**params (dict) – Estimator parameters.
- Returns:
self – Estimator instance.
- Return type:
estimator instance
pythresh.thresholds.karch module
- class pythresh.thresholds.karch.KARCH(ndim=2, method='complex', random_state=1234)[source]
Bases:
BaseThresholderKARCH class for Riemannian Center of Mass thresholder.
Use the Karcher mean (Riemannian Center of Mass) to evaluate a non-parametric means to threshold scores generated by the decision_scores where outliers are set to any value beyond the Karcher mean + one standard deviation of the decision_scores. See [AFS11] for details.
- Parameters:
ndim (int, optional (default=2)) – Number of dimensions to construct the Euclidean manifold
method ({'simple', 'complex'}, optional (default='complex')) –
Method for computing the Karcher mean
’simple’: Compute the Karcher mean using the 1D array of scores
’complex’: Compute the Karcher mean between a 2D array dot product of the scores and the sorted scores arrays
random_state (int, optional (default=1234)) – Random seed for the random number generators of the thresholders. Can also be set to None.
- thresh_
- Type:
threshold value that separates inliers from outliers
- dscores_
- Type:
1D array of decomposed decision scores
Notes
The non-weighted Karcher mean which is also the Riemannian center of mass or the Riemannian geometric mean is defined to be a minimizer of:
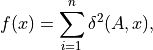
where
 is a member of a special orthogonal group where the group qualities are
 such that the group is a Lie group.
- eval(decision)[source]
Outlier/inlier evaluation process for decision scores.
- Parameters:
decision (np.array or list of shape (n_samples)) – or np.array of shape (n_samples, n_detectors) which are the decision scores from a outlier detection.
- Returns:
outlier_labels – For each observation, tells whether or not it should be considered as an outlier according to the fitted model. 0 stands for inliers and 1 for outliers.
- Return type:
numpy array of shape (n_samples,)
- fit(X, y=None)
Outlier/inlier fit process for decision scores.
- Parameters:
decision (np.array or list of shape (n_samples)) – or np.array of shape (n_samples, n_detectors) which are the decision scores from a outlier detection.
- get_metadata_routing()
Get metadata routing of this object.
Please check User Guide on how the routing mechanism works.
- Returns:
routing – A
MetadataRequestencapsulating routing information.- Return type:
MetadataRequest
- get_params(deep=True)
Get parameters for this estimator.
- predict(X)
Outlier/inlier predict process for decision scores.
- Parameters:
decision (np.array or list of shape (n_samples)) – or np.array of shape (n_samples, n_detectors) which are the decision scores from a outlier detection.
- Returns:
outlier_labels – For each observation, tells whether or not it should be considered as an outlier according to the fitted model. 0 stands for inliers and 1 for outliers.
- Return type:
numpy array of shape (n_samples,)
- set_params(**params)
Set the parameters of this estimator.
The method works on simple estimators as well as on nested objects (such as
Pipeline). The latter have parameters of the form<component>__<parameter>so that it’s possible to update each component of a nested object.- Parameters:
**params (dict) – Estimator parameters.
- Returns:
self – Estimator instance.
- Return type:
estimator instance
pythresh.thresholds.mad module
- class pythresh.thresholds.mad.MAD(factor=1, random_state=1234)[source]
Bases:
BaseThresholderMAD class for Median Absolute Deviation thresholder.
Use the median absolute deviation to evaluate a non-parametric means to threshold scores generated by the decision_scores where outliers are set to any value beyond the mean plus the median absolute deviation over the standard deviation. See [NP15] for details.
- Parameters:
- thresh_
- Type:
threshold value that separates inliers from outliers
- dscores_
- Type:
1D array of decomposed decision scores
Notes
The median absolute deviation is defined as:

And the threshold is set such that:
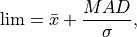
where
and are the mean and
standard deviation of the scores respectively- eval(decision)[source]
Outlier/inlier evaluation process for decision scores.
- Parameters:
decision (np.array or list of shape (n_samples)) – or np.array of shape (n_samples, n_detectors) which are the decision scores from a outlier detection.
- Returns:
outlier_labels – For each observation, tells whether or not it should be considered as an outlier according to the fitted model. 0 stands for inliers and 1 for outliers.
- Return type:
numpy array of shape (n_samples,)
- fit(X, y=None)
Outlier/inlier fit process for decision scores.
- Parameters:
decision (np.array or list of shape (n_samples)) – or np.array of shape (n_samples, n_detectors) which are the decision scores from a outlier detection.
- get_metadata_routing()
Get metadata routing of this object.
Please check User Guide on how the routing mechanism works.
- Returns:
routing – A
MetadataRequestencapsulating routing information.- Return type:
MetadataRequest
- get_params(deep=True)
Get parameters for this estimator.
- predict(X)
Outlier/inlier predict process for decision scores.
- Parameters:
decision (np.array or list of shape (n_samples)) – or np.array of shape (n_samples, n_detectors) which are the decision scores from a outlier detection.
- Returns:
outlier_labels – For each observation, tells whether or not it should be considered as an outlier according to the fitted model. 0 stands for inliers and 1 for outliers.
- Return type:
numpy array of shape (n_samples,)
- set_params(**params)
Set the parameters of this estimator.
The method works on simple estimators as well as on nested objects (such as
Pipeline). The latter have parameters of the form<component>__<parameter>so that it’s possible to update each component of a nested object.- Parameters:
**params (dict) – Estimator parameters.
- Returns:
self – Estimator instance.
- Return type:
estimator instance
pythresh.thresholds.mcst module
- class pythresh.thresholds.mcst.MCST(fallback='warn', random_state=1234)[source]
Bases:
BaseThresholderMCST class for Monte Carlo Shapiro Tests thresholder.
Use uniform random sampling and statistical testing to evaluate a non-parametric means to threshold scores generated by the decision_scores where outliers are set to any value beyond the minimum value left after iterative Shapiro-Wilk tests have occurred. Note** accuracy decreases with array size. For good results the should be array<1000. However still this threshold method may fail at any array size. See [Coi08] for details.
- Parameters:
fallback (str ('ignore', 'warn', 'raise'), optional (default='warn')) – The action to take for thresholders when their criterion are not met. In these cases when set to ‘ignore’ on eval and fit all train data is set to inliers and the threshold is set to max of the train scores + eps. Passing ‘warn’ will do the same as ‘ignore’ but also produce a warning. If ‘raise’, the thresholder raises a ValueError.
random_state (int, optional (default=1234)) – Random seed for the uniform distribution. Can also be set to None.
- thresh_
- Type:
threshold value that separates inliers from outliers
- dscores_
- Type:
1D array of decomposed decision scores
Notes
The Shapiro-Wilk test is a frequentist statistical test for normality. It is used to test the null-hypothesis that the decision scores came from a normal distribution. This test statistic is defined as:
where
is the mean of the scores and  is the ith-smallest number in the sample (kth order statistic). The
coefficients
is the ith-smallest number in the sample (kth order statistic). The
coefficients  is given by:
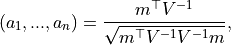
where the vector
 and
and  is the covariance matrix of the order statistics.
The threshold is set by first calculating an initial Shapiro-Wilk test p-value on the decision scores. Using Monte Carlo simulations, random values between 0-1 are inserted into the normalized decision scores and p-values are calculated. if the p-value is higher than the initial p-value, the initial p-value is set to this value and the random value is stored. The minimum stored random value is set as the threshold as it is the minimum found outlier.
Examples
The effects of randomness can affect the thresholder’s output performance significantly. Therefore, to alleviate the effects of randomness on the thresholder a combined model can be used with different random_state values. E.g.
# train the KNN detector
from pyod.models.knn import KNN
from pythresh.thresholds.comb import COMB
from pythresh.thresholds.mcst import MCST

clf = KNN()
clf.fit(X_train)

# get outlier scores
decision_scores = clf.decision_scores_  # raw outlier scores

# get outlier labels with combined model
thres = COMB(thresholders = [MCST(random_state=1234),
MCST(random_state=42), MCST(random_state=9685),
MCST(random_state=111222)])
labels = thres.eval(decision_scores)
- eval(decision)[source]
Outlier/inlier evaluation process for decision scores.
- Parameters:
decision (np.array or list of shape (n_samples)) – or np.array of shape (n_samples, n_detectors) which are the decision scores from a outlier detection.
- Returns:
outlier_labels – For each observation, tells whether or not it should be considered as an outlier according to the fitted model. 0 stands for inliers and 1 for outliers.
- Return type:
numpy array of shape (n_samples,)
- fit(X, y=None)
Outlier/inlier fit process for decision scores.
- Parameters:
decision (np.array or list of shape (n_samples)) – or np.array of shape (n_samples, n_detectors) which are the decision scores from a outlier detection.
- get_metadata_routing()
Get metadata routing of this object.
Please check User Guide on how the routing mechanism works.
- Returns:
routing – A
MetadataRequestencapsulating routing information.- Return type:
MetadataRequest
- get_params(deep=True)
Get parameters for this estimator.
- predict(X)
Outlier/inlier predict process for decision scores.
- Parameters:
decision (np.array or list of shape (n_samples)) – or np.array of shape (n_samples, n_detectors) which are the decision scores from a outlier detection.
- Returns:
outlier_labels – For each observation, tells whether or not it should be considered as an outlier according to the fitted model. 0 stands for inliers and 1 for outliers.
- Return type:
numpy array of shape (n_samples,)
- set_params(**params)
Set the parameters of this estimator.
The method works on simple estimators as well as on nested objects (such as
Pipeline). The latter have parameters of the form<component>__<parameter>so that it’s possible to update each component of a nested object.- Parameters:
**params (dict) – Estimator parameters.
- Returns:
self – Estimator instance.
- Return type:
estimator instance
pythresh.thresholds.meta module
- class pythresh.thresholds.meta.META(method='GNBM', random_state=1234)[source]
Bases:
BaseThresholderMETA class for Meta-modelling thresholder.
Use a trained meta-model to evaluate a non-parametric means to threshold scores generated by the decision_scores where outliers are set based on the trained meta-model classifier. See [ZRA20] for details.
- Parameters:
method ({'LIN', 'GNB', 'GNBC', 'GNBM'}, optional (default='GNBM')) –
select
’LIN’: RidgeCV trained linear classifier meta-model on true labels
’GNB’: Gaussian Naive Bayes trained classifier meta-model on true labels
’GNBC’: Gaussian Naive Bayes trained classifier meta-model on best contamination
’GNBM’: Gaussian Naive Bayes multivariate trained classifier meta-model
random_state (int, optional (default=1234)) – Random seed for the random number generators of the thresholders. Can also be set to None.
- thresh_
- Type:
threshold value that separates inliers from outliers
- dscores_
- Type:
1D array of decomposed decision scores
Notes
Meta-modelling is the creation of a model of models. If a dataset that contains only the explanatory variables (X), yet no response variable (y), it can still be predicted by using a meta-model. This is done by modelling datasets with known response variables that are similar to the dataset that is missing the response variable.
The META thresholder was trained using the
PyODoutlier detection methodsLODA, QMCD, CD, MCD, GMM, KNN, KDE, PCA, SamplingandIForeston the AD benchmark datasets:ALOI, annthyroid, breastw, campaign, cardio, Cardiotocography, fault, glass, Hepatitis, Ionosphere, landsat, letter, Lymphography, magic.gamma, mammography, mnist, musk, optdigits, PageBlocks, pendigits, Pima, satellite, satimage-2, shuttle, smtp, SpamBase, speech, Stamps, thyroid, vertebral, vowels, Waveform, WBC, WDBC, Wilt, wine, WPBC, yeastavailable at ADBench dataset. META uses a majority vote of all the trained models to determine the inlier/outlier labels.Update: the latest GNBC model was further trained on the
backdoor, celeba, census, cover, donors, fraud, http, InternetAds,andskindatasets and additionally using theAutoEncoder, LUNAR, OCSVM, HBOS, KPCA,andDIFoutlier detection methods.- eval(decision)[source]
Outlier/inlier evaluation process for decision scores.
- Parameters:
decision (np.array or list of shape (n_samples)) – or np.array of shape (n_samples, n_detectors) which are the decision scores from a outlier detection.
- Returns:
outlier_labels – For each observation, tells whether or not it should be considered as an outlier according to the fitted model. 0 stands for inliers and 1 for outliers.
- Return type:
numpy array of shape (n_samples,)
- fit(X, y=None)
Outlier/inlier fit process for decision scores.
- Parameters:
decision (np.array or list of shape (n_samples)) – or np.array of shape (n_samples, n_detectors) which are the decision scores from a outlier detection.
- get_metadata_routing()
Get metadata routing of this object.
Please check User Guide on how the routing mechanism works.
- Returns:
routing – A
MetadataRequestencapsulating routing information.- Return type:
MetadataRequest
- get_params(deep=True)
Get parameters for this estimator.
- predict(X)
Outlier/inlier predict process for decision scores.
- Parameters:
decision (np.array or list of shape (n_samples)) – or np.array of shape (n_samples, n_detectors) which are the decision scores from a outlier detection.
- Returns:
outlier_labels – For each observation, tells whether or not it should be considered as an outlier according to the fitted model. 0 stands for inliers and 1 for outliers.
- Return type:
numpy array of shape (n_samples,)
- set_params(**params)
Set the parameters of this estimator.
The method works on simple estimators as well as on nested objects (such as
Pipeline). The latter have parameters of the form<component>__<parameter>so that it’s possible to update each component of a nested object.- Parameters:
**params (dict) – Estimator parameters.
- Returns:
self – Estimator instance.
- Return type:
estimator instance
pythresh.thresholds.mixmod module
- class pythresh.thresholds.mixmod.MIXMOD(method='mean', tol=1e-05, max_iter=250, random_state=1234)[source]
Bases:
BaseThresholderMIXMOD class for the Normal & Non-Normal Mixture Models thresholder.
Use normal & non-normal mixture models to find a non-parametric means to threshold scores generated by the decision_scores, where outliers are set to any value beyond the posterior probability threshold for equal posteriors of a two distribution mixture model. See [vV23] for details
- Parameters:
method (str, optional (default='mean')) – Method to evaluate selecting the best fit mixture model. Default ‘mean’ sets this as the closest mixture models to the mean of the posterior probability threshold for equal posteriors of a two distribution mixture model for all fits. Setting ‘ks’ uses the two-sample Kolmogorov-Smirnov test for goodness of fit.
tol (float, optional (default=1e-5)) – Tolerance for convergence of the EM fit
max_iter (int, optional (default=250)) – Max number of iterations to run EM during fit
random_state (int, optional (default=1234)) – Random seed for the random number generators of the thresholders. Can also be set to None.
- thresh_
- Type:
threshold value that separates inliers from outliers
- dscores_
- Type:
1D array of decomposed decision scores
- mixture_
- Type:
fitted mixture model class of the selected model used for thresholding
Notes
The Normal & Non-Normal Mixture Models thresholder is constructed by searching all possible two component combinations of the following distributions (normal, lognormal, uniform, student’s t, pareto, laplace, gamma, fisk, and exponential). Each two component combination mixture is is fit to the data using expectation-maximization (EM) using the corresponding maximum likelihood estimation functions (MLE) for each distribution. From this the posterior probability threshold is obtained as the point where equal posteriors of a two distribution mixture model exists.
- eval(decision)[source]
Outlier/inlier evaluation process for decision scores.
- Parameters:
decision (np.array or list of shape (n_samples)) – or np.array of shape (n_samples, n_detectors) which are the decision scores from a outlier detection.
- Returns:
outlier_labels – For each observation, tells whether or not it should be considered as an outlier according to the fitted model. 0 stands for inliers and 1 for outliers.
- Return type:
numpy array of shape (n_samples,)
- fit(X, y=None)
Outlier/inlier fit process for decision scores.
- Parameters:
decision (np.array or list of shape (n_samples)) – or np.array of shape (n_samples, n_detectors) which are the decision scores from a outlier detection.
- get_metadata_routing()
Get metadata routing of this object.
Please check User Guide on how the routing mechanism works.
- Returns:
routing – A
MetadataRequestencapsulating routing information.- Return type:
MetadataRequest
- get_params(deep=True)
Get parameters for this estimator.
- predict(X)
Outlier/inlier predict process for decision scores.
- Parameters:
decision (np.array or list of shape (n_samples)) – or np.array of shape (n_samples, n_detectors) which are the decision scores from a outlier detection.
- Returns:
outlier_labels – For each observation, tells whether or not it should be considered as an outlier according to the fitted model. 0 stands for inliers and 1 for outliers.
- Return type:
numpy array of shape (n_samples,)
- set_params(**params)
Set the parameters of this estimator.
The method works on simple estimators as well as on nested objects (such as
Pipeline). The latter have parameters of the form<component>__<parameter>so that it’s possible to update each component of a nested object.- Parameters:
**params (dict) – Estimator parameters.
- Returns:
self – Estimator instance.
- Return type:
estimator instance
pythresh.thresholds.moll module
- class pythresh.thresholds.moll.MOLL(random_state=1234)[source]
Bases:
BaseThresholderMOLL class for Friedrichs’ mollifier thresholder.
Use the Friedrichs’ mollifier to evaluate a non-parametric means to threshold scores generated by the decision_scores where outliers are set to any value beyond one minus the maximum of the smoothed dataset via convolution. See [KS97] for details.
- Parameters:
random_state (int, optional (default=1234)) – Random seed for the uniform distribution. Can also be set to None.
- thresh_
- Type:
threshold value that separates inliers from outliers
- dscores_
- Type:
1D array of decomposed decision scores
Notes
Friedrichs’ mollifier is a smoothing function that is applied to create sequences of smooth functions. These functions can be used to approximate generalized functions that may be non-smooth. The decision scores are assumed to be a part of a generalized function with a non-smooth nature in terms of the interval space between the scores respectively. Friedrichs’ mollifier is defined by:
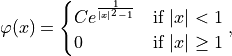
where
 is a normalization constant and
  is the z-scores of pseudo
scores generated over the same range as the scores but with a smaller step size. The
normalization constant is calculated by:
is the z-scores of pseudo
scores generated over the same range as the scores but with a smaller step size. The
normalization constant is calculated by: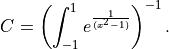
The mollifier is inserted into a discrete convolution operator and the smoothed scores are returned. The threshold is set at one minus the maximum of the smoothed scores.
- eval(decision)[source]
Outlier/inlier evaluation process for decision scores.
- Parameters:
decision (np.array or list of shape (n_samples)) – or np.array of shape (n_samples, n_detectors) which are the decision scores from a outlier detection.
- Returns:
outlier_labels – For each observation, tells whether or not it should be considered as an outlier according to the fitted model. 0 stands for inliers and 1 for outliers.
- Return type:
numpy array of shape (n_samples,)
- fit(X, y=None)
Outlier/inlier fit process for decision scores.
- Parameters:
decision (np.array or list of shape (n_samples)) – or np.array of shape (n_samples, n_detectors) which are the decision scores from a outlier detection.
- get_metadata_routing()
Get metadata routing of this object.
Please check User Guide on how the routing mechanism works.
- Returns:
routing – A
MetadataRequestencapsulating routing information.- Return type:
MetadataRequest
- get_params(deep=True)
Get parameters for this estimator.
- predict(X)
Outlier/inlier predict process for decision scores.
- Parameters:
decision (np.array or list of shape (n_samples)) – or np.array of shape (n_samples, n_detectors) which are the decision scores from a outlier detection.
- Returns:
outlier_labels – For each observation, tells whether or not it should be considered as an outlier according to the fitted model. 0 stands for inliers and 1 for outliers.
- Return type:
numpy array of shape (n_samples,)
- set_params(**params)
Set the parameters of this estimator.
The method works on simple estimators as well as on nested objects (such as
Pipeline). The latter have parameters of the form<component>__<parameter>so that it’s possible to update each component of a nested object.- Parameters:
**params (dict) – Estimator parameters.
- Returns:
self – Estimator instance.
- Return type:
estimator instance
pythresh.thresholds.mtt module
- class pythresh.thresholds.mtt.MTT(alpha=0.01, fallback='warn', random_state=1234)[source]
Bases:
BaseThresholderMTT class for Modified Thompson Tau test thresholder.
Use the modified Thompson Tau test to evaluate a non-parametric means to threshold scores generated by the decision_scores where outliers are set to any value beyond the smallest outlier detected by the test. See [RRF20] for details.
- Parameters:
alpha (float, optional (default=0.01)) – Confidence level corresponding to the t-Student distribution map to sample
fallback (str ('ignore', 'warn', 'raise'), optional (default='warn')) – The action to take for thresholders when their criterion are not met. In these cases when set to ‘ignore’ on eval and fit all train data is set to inliers and the threshold is set to max of the train scores + eps. Passing ‘warn’ will do the same as ‘ignore’ but also produce a warning. If ‘raise’, the thresholder raises a ValueError.
random_state (int, optional (default=1234)) – Random seed for the random number generators of the thresholders. Can also be set to None.
- thresh_
- Type:
threshold value that separates inliers from outliers
- dscores_
- Type:
1D array of decomposed decision scores
Notes
The Modified Thompson Tau test is a modified univariate t-test that eliminates outliers that are more than a number of standard deviations away from the mean. This method is done iteratively with the Tau critical value being recalculated after each outlier removal until the dataset no longer has data points that fall outside of the criterion. The Tau critical value can be obtained by,
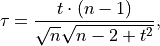
where
is the number of data points and  is the student t-value
- eval(decision)[source]
Outlier/inlier evaluation process for decision scores.
- Parameters:
decision (np.array or list of shape (n_samples)) – or np.array of shape (n_samples, n_detectors) which are the decision scores from a outlier detection.
- Returns:
outlier_labels – For each observation, tells whether or not it should be considered as an outlier according to the fitted model. 0 stands for inliers and 1 for outliers.
- Return type:
numpy array of shape (n_samples,)
- fit(X, y=None)
Outlier/inlier fit process for decision scores.
- Parameters:
decision (np.array or list of shape (n_samples)) – or np.array of shape (n_samples, n_detectors) which are the decision scores from a outlier detection.
- get_metadata_routing()
Get metadata routing of this object.
Please check User Guide on how the routing mechanism works.
- Returns:
routing – A
MetadataRequestencapsulating routing information.- Return type:
MetadataRequest
- get_params(deep=True)
Get parameters for this estimator.
- predict(X)
Outlier/inlier predict process for decision scores.
- Parameters:
decision (np.array or list of shape (n_samples)) – or np.array of shape (n_samples, n_detectors) which are the decision scores from a outlier detection.
- Returns:
outlier_labels – For each observation, tells whether or not it should be considered as an outlier according to the fitted model. 0 stands for inliers and 1 for outliers.
- Return type:
numpy array of shape (n_samples,)
- set_params(**params)
Set the parameters of this estimator.
The method works on simple estimators as well as on nested objects (such as
Pipeline). The latter have parameters of the form<component>__<parameter>so that it’s possible to update each component of a nested object.- Parameters:
**params (dict) – Estimator parameters.
- Returns:
self – Estimator instance.
- Return type:
estimator instance
pythresh.thresholds.ocsvm module
- class pythresh.thresholds.ocsvm.OCSVM(model='sgd', degree='auto', gamma='auto', criterion='bic', nu='auto', tol=0.001, random_state=1234)[source]
Bases:
BaseThresholderOCSVM class for One-Class Support Vector Machine thresholder.
Use a one-class svm to evaluate a non-parametric means to threshold scores generated by the decision_scores where outliers are determined by the one-class svm using a polynomial kernel with the polynomial degree either set or determined by regression internally. See [BCB22] for details.
- Parameters:
model ({'poly', 'sgd'}, optional (default='sgd')) –
OCSVM model to apply
’poly’: Use a polynomial kernel with a regular OCSVM
’sgd’: Used the Additive Chi2 kernel approximation with a SGDOneClassSVM
degree (int, optional (default='auto')) – Polynomial degree to use for the one-class svm. Default ‘auto’ finds the optimal degree with linear regression
gamma (float, optional (default='auto')) – Kernel coefficient for polynomial fit for the one-class svm. Default ‘auto’ uses 1 / n_features
criterion ({'aic', 'bic'}, optional (default='bic')) – regression performance metric. AIC is the Akaike Information Criterion, and BIC is the Bayesian Information Criterion. This only applies when degree is set to ‘auto’
nu (float, optional (default='auto')) – An upper bound on the fraction of training errors and a lower bound of the fraction of support vectors. Default ‘auto’ sets nu as the ratio between the any point that is less than or equal to the median plus the absolute difference between the mean and geometric mean over the the number of points in the entire dataset
tol (float, optional (default=1e-3)) – The stopping criterion for the one-class svm
random_state (int, optional (default=1234)) – Random seed for the SVM’s data sampling. Can also be set to None.
- thresh_
- Type:
threshold value that separates inliers from outliers
Examples
The effects of randomness can affect the thresholder’s output performance significantly. Therefore, to alleviate the effects of randomness on the thresholder a combined model can be used with different random_state values. E.g.
# train the KNN detector
from pyod.models.knn import KNN
from pythresh.thresholds.comb import COMB
from pythresh.thresholds.ocsvm import OCSVM

clf = KNN()
clf.fit(X_train)

# get outlier scores
decision_scores = clf.decision_scores_  # raw outlier scores

# get outlier labels with combined model
thres = COMB(thresholders = [OCSVM(random_state=1234),
OCSVM(random_state=42), OCSVM(random_state=9685),
OCSVM(random_state=111222)])
labels = thres.eval(decision_scores)
- eval(decision)[source]
Outlier/inlier evaluation process for decision scores.
- Parameters:
decision (np.array or list of shape (n_samples)) – or np.array of shape (n_samples, n_detectors) which are the decision scores from a outlier detection.
- Returns:
outlier_labels – For each observation, tells whether or not it should be considered as an outlier according to the fitted model. 0 stands for inliers and 1 for outliers.
- Return type:
numpy array of shape (n_samples,)
- fit(X, y=None)
Outlier/inlier fit process for decision scores.
- Parameters:
decision (np.array or list of shape (n_samples)) – or np.array of shape (n_samples, n_detectors) which are the decision scores from a outlier detection.
- get_metadata_routing()
Get metadata routing of this object.
Please check User Guide on how the routing mechanism works.
- Returns:
routing – A
MetadataRequestencapsulating routing information.- Return type:
MetadataRequest
- get_params(deep=True)
Get parameters for this estimator.
- predict(X)
Outlier/inlier predict process for decision scores.
- Parameters:
decision (np.array or list of shape (n_samples)) – or np.array of shape (n_samples, n_detectors) which are the decision scores from a outlier detection.
- Returns:
outlier_labels – For each observation, tells whether or not it should be considered as an outlier according to the fitted model. 0 stands for inliers and 1 for outliers.
- Return type:
numpy array of shape (n_samples,)
- set_params(**params)
Set the parameters of this estimator.
The method works on simple estimators as well as on nested objects (such as
Pipeline). The latter have parameters of the form<component>__<parameter>so that it’s possible to update each component of a nested object.- Parameters:
**params (dict) – Estimator parameters.
- Returns:
self – Estimator instance.
- Return type:
estimator instance
pythresh.thresholds.qmcd module
- class pythresh.thresholds.qmcd.QMCD(method='WD', lim='P', random_state=1234)[source]
Bases:
BaseThresholderQMCD class for Quasi-Monte Carlo Discrepancy thresholder.
Use the quasi-Monte Carlo discrepancy to evaluate a non-parametric means to threshold scores generated by the decision_scores where outliers are set to any value beyond and percentile or quantile of one minus the discrepancy. See [IRRN19] for details.
- Parameters:
method ({'CD', 'WD', 'MD', 'L2-star'}, optional (default='WD')) –
Type of discrepancy
’CD’: Centered Discrepancy
’WD’: Wrap-around Discrepancy
’MD’: Mix between CD/WD
’L2-star’: L2-star discrepancy
lim ({'Q', 'P'}, optional (default='P')) –
Filtering method to threshold scores using 1 - discrepancy
’Q’: Use quantile limiting
’P’: Use percentile limiting
random_state (int, optional (default=1234)) – Random seed for the random number generators of the thresholders. Can also be set to None.
- thresh_
- Type:
threshold value that separates inliers from outliers
- dscores_
- Type:
1D array of decomposed decision scores
Notes
For the QMCD method it is assumed that the decision scores are pseudo-random values within a distribution
 . “Quasi-random” sequences, which are
numbers that are better equidistributed for than pseudo-random numbers
are used to calculate the decision scores discrepancy value.
. “Quasi-random” sequences, which are
numbers that are better equidistributed for than pseudo-random numbers
are used to calculate the decision scores discrepancy value.The discrepancy value is a uniformity criterion which is used to assess the space filling of a number of samples in a hypercube. It quantifies the distance between the continuous uniform distribution on a hypercube and the discrete uniform distribution on distinct sample points. Therefore, lower values mean better coverage of the parameter space.
The QMCD method utilizes the discrepancy value by assuming that when it is at its lowest value (0) the “quasi-random” generated sequences and the decision scores are equally equidistributed across
. Outliers are assumed to solely raise the discrepancy
value. And therefore, the contamination of the dataset can be set as one minus the
discrepancy.- eval(decision)[source]
Outlier/inlier evaluation process for decision scores.
- Parameters:
decision (np.array or list of shape (n_samples)) – or np.array of shape (n_samples, n_detectors) which are the decision scores from a outlier detection.
- Returns:
outlier_labels – For each observation, tells whether or not it should be considered as an outlier according to the fitted model. 0 stands for inliers and 1 for outliers.
- Return type:
numpy array of shape (n_samples,)
- fit(X, y=None)
Outlier/inlier fit process for decision scores.
- Parameters:
decision (np.array or list of shape (n_samples)) – or np.array of shape (n_samples, n_detectors) which are the decision scores from a outlier detection.
- get_metadata_routing()
Get metadata routing of this object.
Please check User Guide on how the routing mechanism works.
- Returns:
routing – A
MetadataRequestencapsulating routing information.- Return type:
MetadataRequest
- get_params(deep=True)
Get parameters for this estimator.
- predict(X)
Outlier/inlier predict process for decision scores.
- Parameters:
decision (np.array or list of shape (n_samples)) – or np.array of shape (n_samples, n_detectors) which are the decision scores from a outlier detection.
- Returns:
outlier_labels – For each observation, tells whether or not it should be considered as an outlier according to the fitted model. 0 stands for inliers and 1 for outliers.
- Return type:
numpy array of shape (n_samples,)
- set_params(**params)
Set the parameters of this estimator.
The method works on simple estimators as well as on nested objects (such as
Pipeline). The latter have parameters of the form<component>__<parameter>so that it’s possible to update each component of a nested object.- Parameters:
**params (dict) – Estimator parameters.
- Returns:
self – Estimator instance.
- Return type:
estimator instance
pythresh.thresholds.regr module
- class pythresh.thresholds.regr.REGR(method='siegel', fallback='warn', random_state=1234)[source]
Bases:
BaseThresholderREGR class for Regression based thresholder.
Use the regression to evaluate a non-parametric means to threshold scores generated by the decision_scores where outliers are set to any value beyond the y-intercept value of the linear fit. See [Agg17] for details.
- Parameters:
method ({'siegel', 'theil'}, optional (default='siegel')) –
Regression based method to calculate the y-intercept
’siegel’: implements a method for robust linear regression using repeated medians
’theil’: implements a method for robust linear regression using paired values
fallback (str ('ignore', 'warn', 'raise'), optional (default='warn')) – The action to take for thresholders when their criterion are not met. In these cases when set to ‘ignore’ on eval and fit all train data is set to inliers and the threshold is set to max of the train scores + eps. Passing ‘warn’ will do the same as ‘ignore’ but also produce a warning. If ‘raise’, the thresholder raises a ValueError.
random_state (int, optional (default=1234)) – random seed for the normal distribution. Can also be set to None
- thresh_
- Type:
threshold value that separates inliers from outliers
Examples
The effects of randomness can affect the thresholder’s output performance significantly. Therefore, to alleviate the effects of randomness on the thresholder a combined model can be used with different random_state values. E.g.
# train the KNN detector
from pyod.models.knn import KNN
from pythresh.thresholds.comb import COMB
from pythresh.thresholds.regr import REGR

clf = KNN()
clf.fit(X_train)

# get outlier scores
decision_scores = clf.decision_scores_  # raw outlier scores

# get outlier labels with combined model
thres = COMB(thresholders = [REGR(random_state=1234),
REGR(random_state=42), REGR(random_state=9685),
REGR(random_state=111222)])
labels = thres.eval(decision_scores)
- eval(decision)[source]
Outlier/inlier evaluation process for decision scores.
- Parameters:
decision (np.array or list of shape (n_samples)) – or np.array of shape (n_samples, n_detectors) which are the decision scores from a outlier detection.
- Returns:
outlier_labels – For each observation, tells whether or not it should be considered as an outlier according to the fitted model. 0 stands for inliers and 1 for outliers.
- Return type:
numpy array of shape (n_samples,)
- fit(X, y=None)
Outlier/inlier fit process for decision scores.
- Parameters:
decision (np.array or list of shape (n_samples)) – or np.array of shape (n_samples, n_detectors) which are the decision scores from a outlier detection.
- get_metadata_routing()
Get metadata routing of this object.
Please check User Guide on how the routing mechanism works.
- Returns:
routing – A
MetadataRequestencapsulating routing information.- Return type:
MetadataRequest
- get_params(deep=True)
Get parameters for this estimator.
- predict(X)
Outlier/inlier predict process for decision scores.
- Parameters:
decision (np.array or list of shape (n_samples)) – or np.array of shape (n_samples, n_detectors) which are the decision scores from a outlier detection.
- Returns:
outlier_labels – For each observation, tells whether or not it should be considered as an outlier according to the fitted model. 0 stands for inliers and 1 for outliers.
- Return type:
numpy array of shape (n_samples,)
- set_params(**params)
Set the parameters of this estimator.
The method works on simple estimators as well as on nested objects (such as
Pipeline). The latter have parameters of the form<component>__<parameter>so that it’s possible to update each component of a nested object.- Parameters:
**params (dict) – Estimator parameters.
- Returns:
self – Estimator instance.
- Return type:
estimator instance
pythresh.thresholds.vae module
- class pythresh.thresholds.vae.VAE(verbose=False, device='cpu', latent_dims='auto', random_state=1234, epochs=100, batch_size=64, loss='kl')[source]
Bases:
BaseThresholderVAE class for Variational AutoEncoder thresholder.
Use a VAE to evaluate a non-parametric means to threshold scores generated by the decision_scores where outliers are set to any value beyond the maximum minus the minimum of the reconstructed distribution probabilities after encoding. See [XYA20] for details
- Parameters:
verbose (bool, optional (default=False)) – display training progress
device (str, optional (default='cpu')) – device for pytorch
latent_dims (int, optional (default='auto')) – number of latent dimensions the encoder will map the scores to. Default ‘auto’ applies automatic dimensionality selection using a profile likelihood.
random_state (int, optional (default=1234)) – random seed for the normal distribution. Can also be set to None
epochs (int, optional (default=100)) – number of epochs to train the VAE
batch_size (int, optional (default=64)) – batch size for the dataloader during training
loss (str, optional (default='kl')) –
Loss function during training
’kl’ : use the combined negative log likelihood and Kullback-Leibler divergence
’mmd’: use the combined negative log likelihood and maximum mean discrepancy
- thresh_
- Type:
threshold value that separates inliers from outliers
Examples
The effects of randomness can affect the thresholder’s output performance significantly. Therefore, to alleviate the effects of randomness on the thresholder a combined model can be used with different random_state values. E.g.
# train the KNN detector
from pyod.models.knn import KNN
from pythresh.thresholds.comb import COMB
from pythresh.thresholds.vae import VAE

clf = KNN()
clf.fit(X_train)

# get outlier scores
decision_scores = clf.decision_scores_  # raw outlier scores

# get outlier labels with combined model
thres = COMB(thresholders = [VAE(random_state=1234),
VAE(random_state=42), VAE(random_state=9685),
VAE(random_state=111222)])
labels = thres.eval(decision_scores)
- eval(decision)[source]
Outlier/inlier evaluation process for decision scores.
- Parameters:
decision (np.array or list of shape (n_samples)) – or np.array of shape (n_samples, n_detectors) which are the decision scores from a outlier detection.
- Returns:
outlier_labels – For each observation, tells whether or not it should be considered as an outlier according to the fitted model. 0 stands for inliers and 1 for outliers.
- Return type:
numpy array of shape (n_samples,)
- fit(X, y=None)
Outlier/inlier fit process for decision scores.
- Parameters:
decision (np.array or list of shape (n_samples)) – or np.array of shape (n_samples, n_detectors) which are the decision scores from a outlier detection.
- get_metadata_routing()
Get metadata routing of this object.
Please check User Guide on how the routing mechanism works.
- Returns:
routing – A
MetadataRequestencapsulating routing information.- Return type:
MetadataRequest
- get_params(deep=True)
Get parameters for this estimator.
- set_params(**params)
Set the parameters of this estimator.
The method works on simple estimators as well as on nested objects (such as
Pipeline). The latter have parameters of the form<component>__<parameter>so that it’s possible to update each component of a nested object.- Parameters:
**params (dict) – Estimator parameters.
- Returns:
self – Estimator instance.
- Return type:
estimator instance
pythresh.thresholds.wind module
- class pythresh.thresholds.wind.WIND(random_state=1234)[source]
Bases:
BaseThresholderWIND class for topological Winding number thresholder.
Use the topological winding number (with respect to the origin) to evaluate a non-parametric means to threshold scores generated by the decision_scores where outliers are set to any value beyond the mean intersection point calculated from the winding number. See [JKSH13] for details.
- Parameters:
random_state (int, optional (default=1234)) – Random seed for the normal distribution. Can also be set to None.
- thresh_
- Type:
threshold value that separates inliers from outliers
- dscores_
- Type:
1D array of decomposed decision scores
Notes
The topological winding number or the degree of a continuous mapping. It is an integer sum of the number of completed/closed counterclockwise rotations in a plane around a point. And is given by,
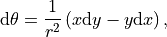
where

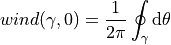
The winding number intuitively captures self-intersections/contours, with a change in the distribution of the dataset or shift from inliers to outliers relating to these intersections. With this, it is assumed that if an intersection exists, then adjacent/incident regions must have different region labels. Since multiple intersection regions may exist. The threshold between inliers and outliers is taken as the mean intersection point.
Examples
The effects of randomness can affect the thresholder’s output performance significantly. Therefore, to alleviate the effects of randomness on the thresholder a combined model can be used with different random_state values. E.g.
# train the KNN detector
from pyod.models.knn import KNN
from pythresh.thresholds.comb import COMB
from pythresh.thresholds.wind import WIND

clf = KNN()
clf.fit(X_train)

# get outlier scores
decision_scores = clf.decision_scores_  # raw outlier scores

# get outlier labels with combined model
thres = COMB(thresholders = [WIND(random_state=1234),
WIND(random_state=42), WIND(random_state=9685),
WIND(random_state=111222)])
labels = thres.eval(decision_scores)
- eval(decision)[source]
Outlier/inlier evaluation process for decision scores.
- Parameters:
decision (np.array or list of shape (n_samples)) – or np.array of shape (n_samples, n_detectors) which are the decision scores from a outlier detection.
- Returns:
outlier_labels – For each observation, tells whether or not it should be considered as an outlier according to the fitted model. 0 stands for inliers and 1 for outliers.
- Return type:
numpy array of shape (n_samples,)
- fit(X, y=None)
Outlier/inlier fit process for decision scores.
- Parameters:
decision (np.array or list of shape (n_samples)) – or np.array of shape (n_samples, n_detectors) which are the decision scores from a outlier detection.
- get_metadata_routing()
Get metadata routing of this object.
Please check User Guide on how the routing mechanism works.
- Returns:
routing – A
MetadataRequestencapsulating routing information.- Return type:
MetadataRequest
- get_params(deep=True)
Get parameters for this estimator.
- predict(X)
Outlier/inlier predict process for decision scores.
- Parameters:
decision (np.array or list of shape (n_samples)) – or np.array of shape (n_samples, n_detectors) which are the decision scores from a outlier detection.
- Returns:
outlier_labels – For each observation, tells whether or not it should be considered as an outlier according to the fitted model. 0 stands for inliers and 1 for outliers.
- Return type:
numpy array of shape (n_samples,)
- set_params(**params)
Set the parameters of this estimator.
The method works on simple estimators as well as on nested objects (such as
Pipeline). The latter have parameters of the form<component>__<parameter>so that it’s possible to update each component of a nested object.- Parameters:
**params (dict) – Estimator parameters.
- Returns:
self – Estimator instance.
- Return type:
estimator instance
pythresh.thresholds.yj module
- class pythresh.thresholds.yj.YJ(random_state=1234)[source]
Bases:
BaseThresholderYJ class for Yeo-Johnson transformation thresholder.
Use the Yeo-Johnson transformation to evaluate a non-parametric means to threshold scores generated by the decision_scores where outliers are set to any value beyond the max value in the YJ transformed data. See [RR21] for details.
- Parameters:
random_state (int, optional (default=1234)) – Random seed for the random number generators of the thresholders. Can also be set to None.
- thresh_
- Type:
threshold value that separates inliers from outliers
- dscores_
- Type:
1D array of decomposed decision scores
Notes
The Yeo-Johnson transformation is a power transform which is a set of power functions that apply a monotonic transformation to the dataset. For the decision scores this make their distribution more normal-like. The transformation is given by:
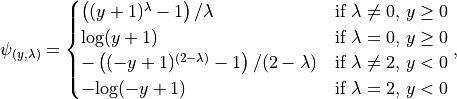
where
 is a power parameter that is chosen via maximum
likelihood estimation. Therefore, any values from the original decision
scores that are beyond maximum value after this transformation are
considered outliers. However, the closer a set of decision scores are
to a normal distribution originally the smaller the probability this
threshold will be able to identify outliers.
is a power parameter that is chosen via maximum
likelihood estimation. Therefore, any values from the original decision
scores that are beyond maximum value after this transformation are
considered outliers. However, the closer a set of decision scores are
to a normal distribution originally the smaller the probability this
threshold will be able to identify outliers.- eval(decision)[source]
Outlier/inlier evaluation process for decision scores.
- Parameters:
decision (np.array or list of shape (n_samples)) – or np.array of shape (n_samples, n_detectors) which are the decision scores from a outlier detection.
- Returns:
outlier_labels – For each observation, tells whether or not it should be considered as an outlier according to the fitted model. 0 stands for inliers and 1 for outliers.
- Return type:
numpy array of shape (n_samples,)
- fit(X, y=None)
Outlier/inlier fit process for decision scores.
- Parameters:
decision (np.array or list of shape (n_samples)) – or np.array of shape (n_samples, n_detectors) which are the decision scores from a outlier detection.
- get_metadata_routing()
Get metadata routing of this object.
Please check User Guide on how the routing mechanism works.
- Returns:
routing – A
MetadataRequestencapsulating routing information.- Return type:
MetadataRequest
- get_params(deep=True)
Get parameters for this estimator.
- predict(X)
Outlier/inlier predict process for decision scores.
- Parameters:
decision (np.array or list of shape (n_samples)) – or np.array of shape (n_samples, n_detectors) which are the decision scores from a outlier detection.
- Returns:
outlier_labels – For each observation, tells whether or not it should be considered as an outlier according to the fitted model. 0 stands for inliers and 1 for outliers.
- Return type:
numpy array of shape (n_samples,)
- set_params(**params)
Set the parameters of this estimator.
The method works on simple estimators as well as on nested objects (such as
Pipeline). The latter have parameters of the form<component>__<parameter>so that it’s possible to update each component of a nested object.- Parameters:
**params (dict) – Estimator parameters.
- Returns:
self – Estimator instance.
- Return type:
estimator instance
pythresh.thresholds.zscore module
- class pythresh.thresholds.zscore.ZSCORE(factor=1, random_state=1234)[source]
Bases:
BaseThresholderZSCORE class for ZSCORE thresholder.
Use the zscore to evaluate a non-parametric means to threshold scores generated by the decision_scores where outliers are set to any value beyond a zscore of one. See [BP20] for details.
- Parameters:
- thresh_
- Type:
threshold value that separates inliers from outliers
- dscores_
- Type:
1D array of decomposed decision scores
Notes
The z-score can be calculated as follows:

where
and are the mean and the
standard deviation of the decision scores respectively. The threshold
is set that any value beyond an absolute z-score of 1 is considered
and outlier.- eval(decision)[source]
Outlier/inlier evaluation process for decision scores.
- Parameters:
decision (np.array or list of shape (n_samples)) – or np.array of shape (n_samples, n_detectors) which are the decision scores from a outlier detection.
- Returns:
outlier_labels – For each observation, tells whether or not it should be considered as an outlier according to the fitted model. 0 stands for inliers and 1 for outliers.
- Return type:
numpy array of shape (n_samples,)
- fit(X, y=None)
Outlier/inlier fit process for decision scores.
- Parameters:
decision (np.array or list of shape (n_samples)) – or np.array of shape (n_samples, n_detectors) which are the decision scores from a outlier detection.
- get_metadata_routing()
Get metadata routing of this object.
Please check User Guide on how the routing mechanism works.
- Returns:
routing – A
MetadataRequestencapsulating routing information.- Return type:
MetadataRequest
- get_params(deep=True)
Get parameters for this estimator.
- predict(X)
Outlier/inlier predict process for decision scores.
- Parameters:
decision (np.array or list of shape (n_samples)) – or np.array of shape (n_samples, n_detectors) which are the decision scores from a outlier detection.
- Returns:
outlier_labels – For each observation, tells whether or not it should be considered as an outlier according to the fitted model. 0 stands for inliers and 1 for outliers.
- Return type:
numpy array of shape (n_samples,)
- set_params(**params)
Set the parameters of this estimator.
The method works on simple estimators as well as on nested objects (such as
Pipeline). The latter have parameters of the form<component>__<parameter>so that it’s possible to update each component of a nested object.- Parameters:
**params (dict) – Estimator parameters.
- Returns:
self – Estimator instance.
- Return type:
estimator instance
Module contents
References
BIJAN AFSARI. Riemannian lp center of mass: existence, uniqueness, and convexity. Proceedings of the American Mathematical Society, 139(2):655–673, 2011. URL: http://www.jstor.org/stable/41059320 (visited on 2022-06-25).
Charu C. Aggarwal. Linear Models for Outlier Detection. Springer International Publishing, Cham, 2017. URL: https://doi.org/10.1007/978-3-319-47578-3_3, doi:10.1007/978-3-319-47578-3_3.
Mufda Jameel Alrawashdeh. An adjusted grubbs' and generalized extreme studentized deviation. Demonstratio Mathematica, 54(1):548–557, 2021. URL: https://doi.org/10.1515/dema-2021-0041, doi:doi:10.1515/dema-2021-0041.
Daichi Amagata, Makoto Onizuka, and Takahiro Hara. Fast and exact outlier detection in metric spaces: a proximity graph-based approach. 2021. URL: https://arxiv.org/abs/2110.08959, doi:10.48550/ARXIV.2110.08959.
Vilijandas Bagdonavicius and Linas Petkevicius. Multiple outlier detection tests for parametric models. Mathematics, 8(12):2156, dec 2020. URL: https://doi.org/10.3390%2Fmath8122156, doi:10.3390/math8122156.
Alberto Barbado, Oscar Corcho, and Richard Benjamins. Rule extraction in unsupervised anomaly detection for model explainability: application to oneclass svm. Expert Systems with Applications, 189:116100, mar 2022. URL: https://doi.org/10.1016%2Fj.eswa.2021.116100, doi:10.1016/j.eswa.2021.116100.
Jean-Marc Bardet and Solohaja-Faniaha Dimby. A new non-parametric detector of univariate outliers for distributions with unbounded support. Extremes - Statistical Theory and Applications in Science, Engineering and Economics, 2015. URL: https://arxiv.org/abs/1509.02473, doi:10.48550/ARXIV.1509.02473.
Graciela Boente and Ana Pires. Influence functions and outlier detection under the common principal components model: a robust approach. Biometrika, 89:861–875, 02 2002. doi:10.1093/biomet/89.4.861.
L. N. Bolshev and M. Ubaidullaeva. Chauvenet's test in the classical theory of errors. Theory of Probability & Its Applications, 19(4):683–692, 1975. doi:10.1137/1119078.
Daniele Coin. Testing normality in the presence of outliers. Statistical Methods and Applications, 17:3–12, 02 2008. doi:10.1007/s10260-007-0046-8.
Paul Fearnhead and Guillem Rigaill. Changepoint detection in the presence of outliers. 2016. URL: https://arxiv.org/abs/1609.07363, doi:10.48550/ARXIV.1609.07363.
Michael Friendly, Georges Monette, and John Fox. Elliptical insights: understanding statistical methods through elliptical geometry. Statistical Science, feb 2013. URL: https://doi.org/10.1214%2F12-sts402, doi:10.1214/12-sts402.
Navid Hashemi, Eduardo Verdugo German, Jonatan Pena Ramirez, and Justin Ruths. Filtering approaches for dealing with noise in anomaly detection. In 2019 IEEE 58th Conference on Decision and Control. IEEE, dec 2019. URL: https://doi.org/10.1109%2Fcdc40024.2019.9029258, doi:10.1109/cdc40024.2019.9029258.
Dmitri Iouchtchenko, Neil Raymond, Pierre-Nicholas Roy, and Marcel Nooijen. Deterministic and quasi-random sampling of optimized gaussian mixture distributions for vibronic monte carlo. 2019. URL: https://arxiv.org/abs/1912.11594, doi:10.48550/ARXIV.1912.11594.
Alec Jacobson, Ladislav Kavan, and Olga Sorkine-Hornung. Robust inside-outside segmentation using generalized winding numbers. ACM Transactions on Graphics (TOG), 32:, 07 2013. doi:10.1145/2461912.2461916.
Mohsen Joneidi. Sparse auto-regressive: robust estimation of ar parameters. 2013. URL: https://arxiv.org/abs/1306.3317, doi:10.48550/ARXIV.1306.3317.
Michiel Keyzer and Ben Sonneveld. Using the mollifier method to characterize datasets and models: the case of the universal soil loss equation. ITC Journal, pages 263–272, 1997.
Frank Klawonn and Frank Rehm. Cluster Analysis for Outlier Detection, pages. Idea Group Publishing, 07 2008. doi:10.4018/9781605660103.ch035.
Michael Martin and Steven Roberts. An evaluation of bootstrap methods for outlier detection in least squares regression. Journal of Applied Statistics, 33:703–720, 08 2006. doi:10.1080/02664760600708863.
Archana N. and S. S. Pawar. Periodicity detection of outlier sequences using constraint based pattern tree with mad. ArXiv, 2015. URL: https://arxiv.org/abs/1507.01685, doi:10.48550/ARXIV.1507.01685.
Lorenzo Perini, Paul-Christian Bürkner, and Arto Klami. Estimating the contamination factor's distribution in unsupervised anomaly detection. In Andreas Krause, Emma Brunskill, Kyunghyun Cho, Barbara Engelhardt, Sivan Sabato, and Jonathan Scarlett, editors, Proceedings of the 40th International Conference on Machine Learning, volume 202 of Proceedings of Machine Learning Research, 27668–27679. PMLR, 23–29 Jul 2023. URL: https://proceedings.mlr.press/v202/perini23a.html.
Zhuang Qi, Dazhi Jiang, and Xiaming Chen. Iterative gradient descent for outlier detection. International Journal of Wavelets, Multiresolution and Information Processing, 19:2150004, 02 2021. doi:10.1142/S0219691321500041.
Jakob Raymaekers and Peter J. Rousseeuw. Transforming variables to central normality. Machine Learning, mar 2021. URL: https://doi.org/10.1007%2Fs10994-021-05960-5, doi:10.1007/s10994-021-05960-5.
Ke Ren, Haichuan Yang, Yu Zhao, Mingshan Xue, Hongyu Miao, Shuai Huang, and Ji Liu. A robust auc maximization framework with simultaneous outlier detection and feature selection for positive-unlabeled classification. 2018. URL: https://arxiv.org/abs/1803.06604, doi:10.48550/ARXIV.1803.06604.
Divish Rengasamy, Benjamin Rothwell, and Grazziela Figueredo. Towards a more reliable interpretation of machine learning outputs for safety-critical systems using feature importance fusion. 2020. URL: https://arxiv.org/abs/2009.05501, doi:10.48550/ARXIV.2009.05501.
K. Thanammal, R. Vijayalakshmi, S. Arumugaperumal, and Jayasudha J S. Effective histogram thresholding techniques for natural images using segmentation. Journal of Image and Graphics, 2:, 01 2015. doi:10.12720/joig.2.2.113-116.
Willem van Veluw. Application of mixture models to threshold anomaly scores. Master's thesis, Utrecht University, 2023. URL: https://studenttheses.uu.nl/handle/20.500.12932/45591.
Zhisheng Xiao, Qing Yan, and Yali Amit. Likelihood regret: an out-of-distribution detection score for variational auto-encoder. 2020. URL: https://arxiv.org/abs/2003.02977, doi:10.48550/ARXIV.2003.02977.
Yue Zhao, Ryan A. Rossi, and Leman Akoglu. Automating outlier detection via meta-learning. 2020. URL: https://arxiv.org/abs/2009.10606, doi:10.48550/ARXIV.2009.10606.